CARDIOVASCULAR JOURNAL OF AFRICA • Vol 21, No 5, September/October 2010
AFRICA
249
Editorial
The growing disparity between clinical trial complexity
and investigator compensation
The issue of investigator compensation in clinical trials is a
contentious one, with opinions varying widely between academ-
ic researchers, clinical trialists and pharmaceutical companies.
Many academic researchers maintain that clinical trial budgets
are excessive. Clinical trialists are usually of the opinion that
the study budgets are inadequate considering the many potential
safety issues, the continuous monitoring of patients and the many
‘hidden costs’ involved in clinical trials. Pharmaceutical compa-
nies and clinical research organisations (CROs) are invariably of
the opinion that their study budgets are appropriate.
The Tufts Centre for the Study of Drug Development (CSDD)
recently conducted a study that examined the impact of protocol
design on clinical trial performance. The results indicate that the
median number of procedures per clinical trial increased by 49%
from 2000–2003 to 2004–2007, while the total effort required
to complete these procedures grew by 54%.
1
According to the
author, ‘more complex and burdensome protocols are extend-
ing study cycle times, increasing costs and challenging patient
recruitment and retention’.
1
In addition, the rise in the number of eligibility criteria used to
screen volunteers has negatively affected the number of volunteers
enrolling in clinical trials. This study also found a wide variabil-
ity in the complexity between therapeutic areas and clinical study
phases. Overall, growth in complexity grew at the slowest rate for
phase III protocols as companies begin to gather more data in the
early phases of clinical research in an attempt to minimise costs.
1
There have been growing concerns among investigators
regarding grant amounts and the slow payment process.
2
A review
of more than 52 000 study contracts from the CSDD showed that
grant size has remained relatively constant since 1998, while
the number of procedures per protocol has risen drastically.
2
In addition, the average dollars paid per procedure per patient
has declined by 27% over that same period.
2
This review also
reported that it takes pharmaceutical companies on average
140 business days to pay an investigator for work performed.
2
Retrospective analysis
We conducted a study to investigate firstly, the average payment
per patient per visit at our site, and secondly, to determine the
time taken from date of the patient’s visit to date of site payment
for CROs and for pharmaceutical companies. The study was
conducted by TREAD Research, a site-managed organisation
(SMO) based at Tygerberg Hospital, Parow, Western Cape, South
Africa. Random clinical trial agreement (CTA) budgets for stud-
ies conducted at this site between 2004 and 2009 were retrospec-
tively analysed for the average payment per patient per visit.
An additional analysis retrospectively explored a further 20
randomly chosen studies conducted at this site over the past 10
years (1999–2009). This analysis included 10 studies conducted
by CROs and 10 by pharmaceutical companies. The 20 studies
included in the analysis all had similar procedures and study
designs. The analysis tracked patient visit dates, invoice dates
and the date that payment was reflected in the site’s bank
account. All data were entered into an excel spreadsheet and
descriptive statistics were used to analyse the data.
Major findings
A total of 33 studies’ budgets were analysed, including 28
outpatient risk-factor studies (14 type 2 diabetes mellitus, 10
hypercholesterolemia and four hypertension) and five cardiovas-
cular (CVS) endpoint studies. These results (as shown in Table
1) indicate an average increase of 13% per patient per visit since
2004 for the risk-factor studies (from R2 215 to R2 550) while
the CVS endpoint studies’ budgets decreased by 7% over the
same time period (from R3 525 to R3 287).
An additional analysis investigated the time from the patient’s
TABLE 1.AVERAGE PAYMENT PER PATIENT PERVISIT PER
YEAR IN SOUTHAFRICAN RANDASWELLAS THE PERCENTAGE
CHANGE IN PAYMENT OVER THE SIX-YEAR PERIOD (2004–2009)
Study type
2004 2005 2006 2007 2008 2009
Percentage
change
2004 –
2009 (%)
Risk factor studies (
n
=
28) 2215 2208 1796 2678 2748 2550
+
13%
CVS studies (
n
=
5)
3525 1143 2950 2950 2969 3287 –7%
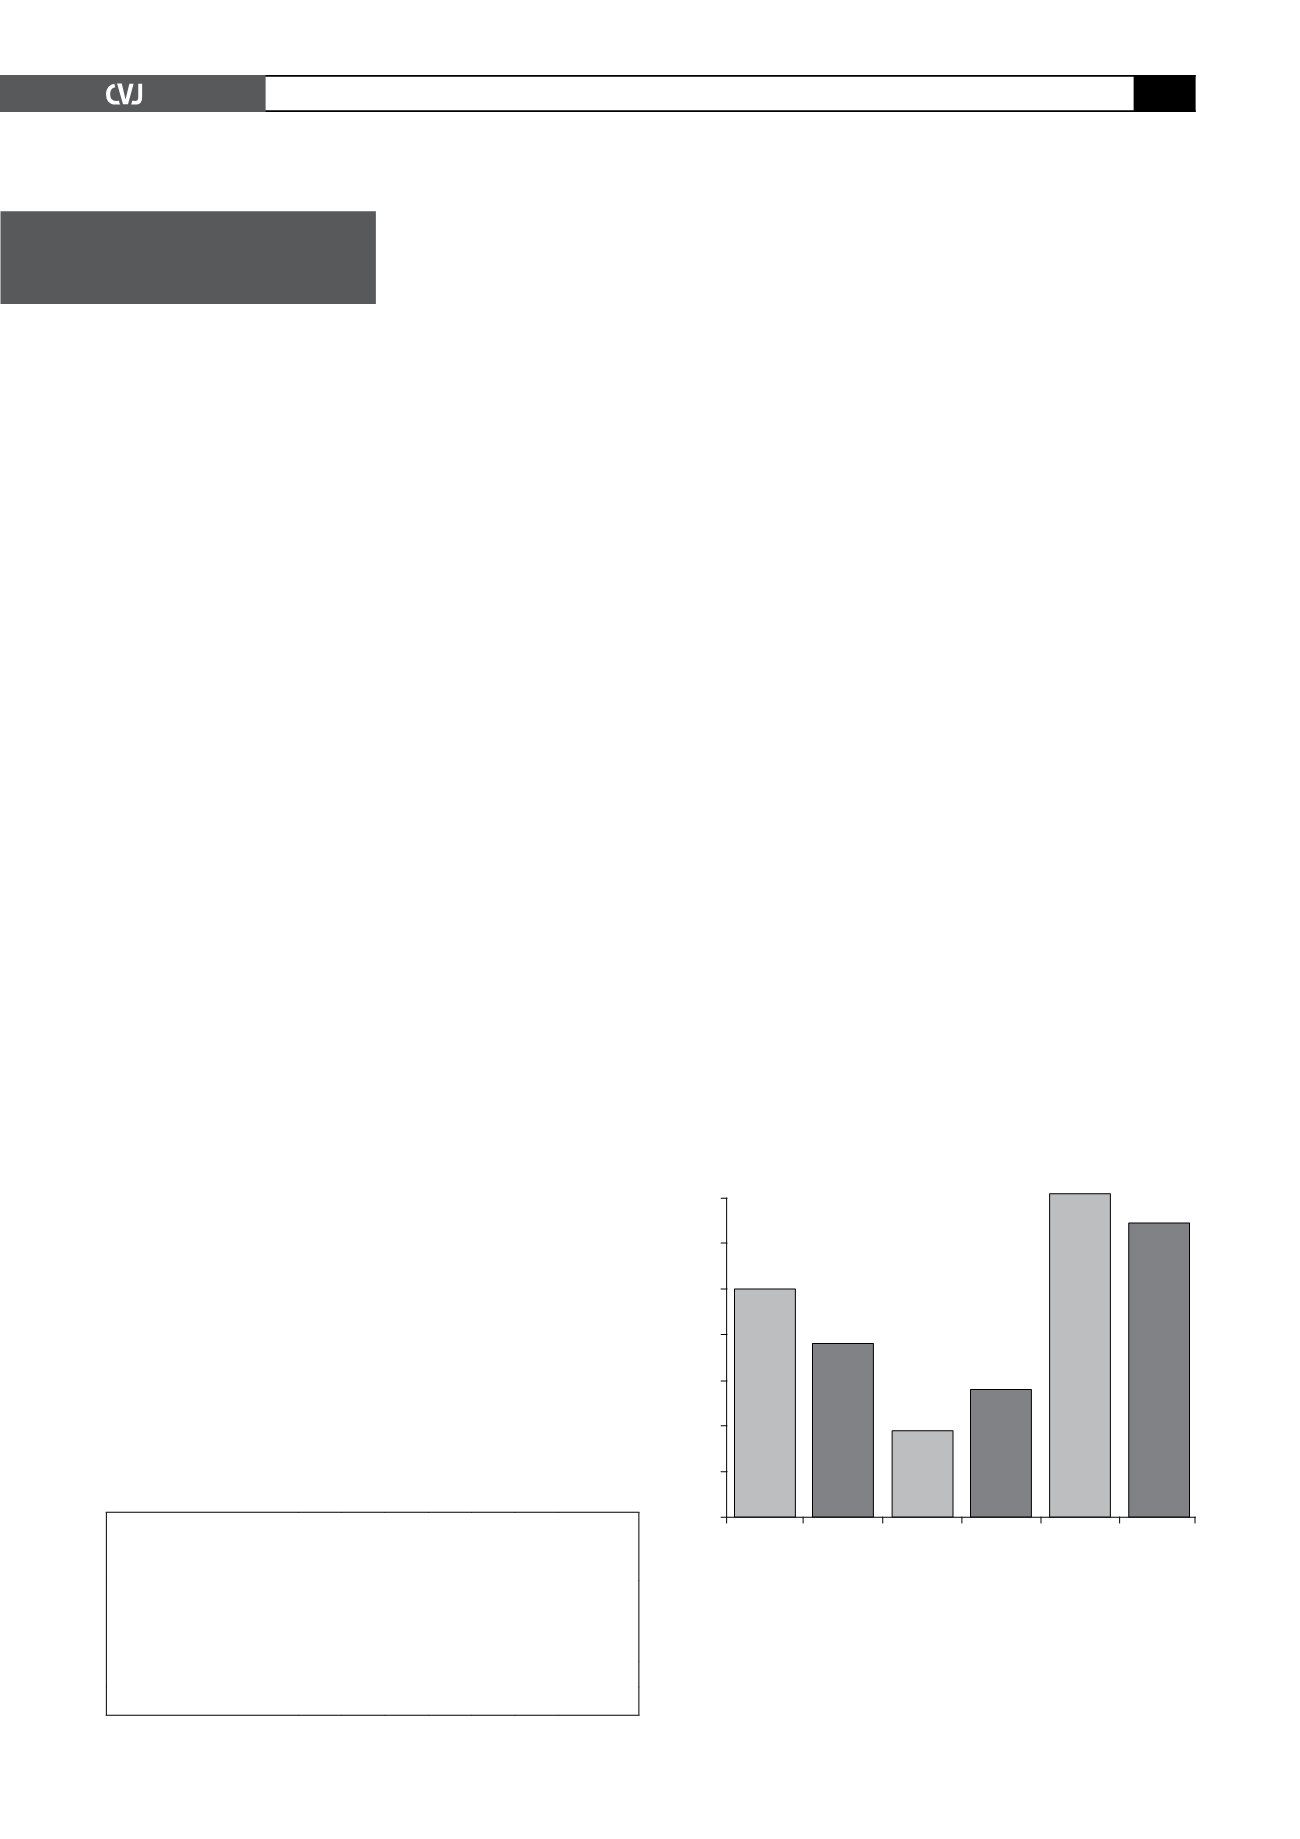
140
120
100
80
60
40
20
0
Time
(visit-
inv)
CRO
Time
(visit-
inv)
SPO
Time
(inv-
bank)
CRO
Time
(inv-
bank)
SPO
Time
(visit-
bank)
CRO
Time
(visit-
bank)
SPO
Fig. 1. Mean time (in days) from patient visit to invoice
generation (visit-inv); from invoice generation to payment
(inv-bank); and from patient visit to payment (visit-bank)
for CROs (CRO) and pharmaceutical companies (SPO) (
n
=
4 771).
Number of days


