CARDIOVASCULAR JOURNAL OF AFRICA • Vol 23, No 1, February 2012
8
AFRICA
subjects, age range 16–95 years. The other 10 subjects were from
other race groups and were excluded. For this study, 600 subjects
were between the ages of 20 and 60 years, 13 were excluded
because they were already on treatment for CVD, three did not
consent to giving blood samples, while one had no blood pres-
sure measurements, resulting in a total of 583 subjects.
Table 1 presents the general characteristics of the 583 partici-
pants eligible for this study, and data are presented as medians
(25th, 75th quartile range). Although the BMI and waist circum-
ference of females were significantly elevated over that of males
(
p
<
0.0001), the CVD risk was significantly higher in males (
p
<
0.0001).
In this study, both lipid- and BMI-dependant equations were
used, and the intra-class correlation (ICC) between the two
equations was 0.92 with a 6% standard error of measurement
(SEM) (Fig. 1). The results are therefore presented using the
lipid-dependent equation.
The pattern of CVD risk factors used in the 30-year risk
calculator is shown in Table 2. Generally, diabetes, hyperten-
sion and percentage CVD risk increased with age. On the other
hand smoking was more prevalent in the younger age group,
20 to 30 years, while overweight (BMI
≥
25,
<
30 kg/m
2
) was
similar across age groups. While diabetes was highest in the age
group 51 to 60 years, undiagnosed diabetes was present in all
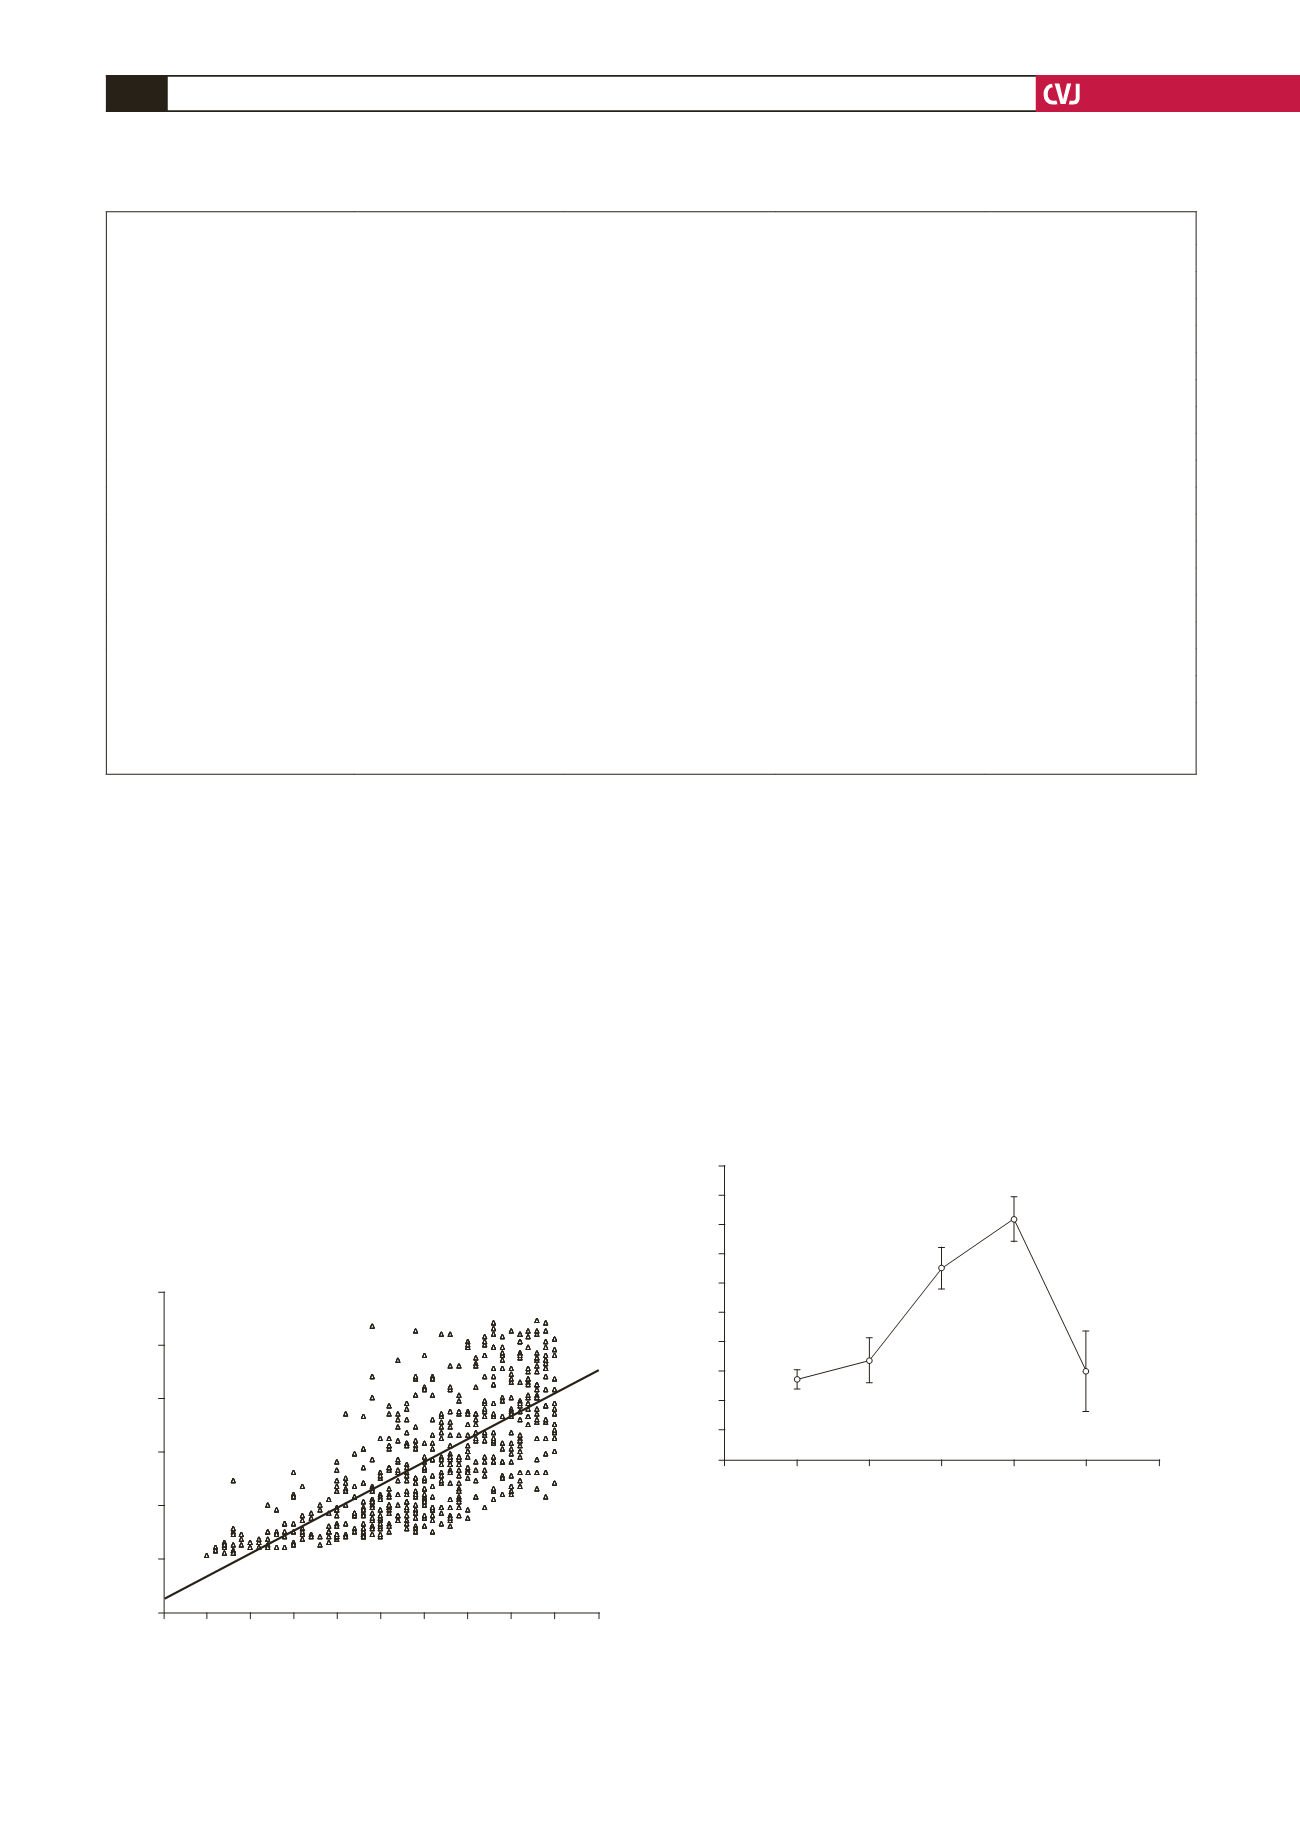
age groups. The scatter plot in Fig. 2 illustrates the effect of age
on increasing CVD risk. Even in those subjects younger than 35
years, some had CVD risk of 20% or more.
The mean 30-year CVD risk among individuals without
diabetes was 33.6%, while in those with undiagnosed and self-
reported diabetes it was more than 50%, (
p
<
0.001) (Fig. 3). In
normoglycaemic females who were of normal weight (BMI
<
25
TABLE 2. CVD RISK FACTORS USED IN THE EQUATION IN DIFFERENTAGE GROUPS
CVD risk factor
Age groups (years)
20–30
31–40
41–50
51–60
% males
9.5
16.7
36.50
37.3
% BMI
<
25 kg/m
2
50
22.95
30.81
20.71
% BMI
≥
25,
<
30 kg/m
2
29.17
24.59
25.12
29.80
% BMI
≥
30 kg/m
2
20.83
52.46
44.08
49.49
SBP (mmHg)*
112.7
±
13.9
113.9
±
13.7
119.4
±
17.1
125.6
±
17.6
TC (mmol/l)*
4.7
±
1.1
5.1
±
1.0
5.4
±
1.1
6.0
±
1.2
HDL-C (mmol/l)*
1.2
±
0.26
1.2
±
0.37
1.3
±
0.35
1.3
±
0.36
% smoking
63.27
49.18
47.42
44.72
TRTBP
10.42
12.30
25.59
47.45
Diabetes status
% IFG
2.04
4.96
5.63
3.52
% IGT
2.04
13.22
15.02
20.60
% undiagnosed DM
4.08
5.79
13.62
18.59
% self-reported DM
0
5.79
6.57
14.07
Lipid full (%)
#
8.5
±
6.9
19.4
±
13.0
35.1
±
17.6
56.6
±
18.2
*Replicated measurements,
#
Mean
±
standard deviation.
BMI, body mass index; SBP, systolic blood pressure; TC, total cholesterol; HDL-C, high-density lipoprotein cholesterol; TRTBP, treatment for
blood pressure; IFG, Impaired fasting glucose; IGT, impaired glucose tolerance, DM, diabetes mellitus.
Fig. 2. CVD risk score for men and women in relation to
their age.
100
80
60
40
20
0
–20
Full CVD outcome
15 20 25 30 35 40 45 50 55 60 65
Age (years)
Fig. 3. Covariance analysis with age as covariate between
the subjects with IFG, IGT, newly diagnosed diabetes
(undiagnosed DM), self-reported diabetes (known DM)
and subjects with normal glucose tolerance (normal).
Significant differences between the groups are denoted
by the letters, a–d. No significant differences were
observed between those with IFG and normal glucose
tolerance. Vertical bars denote 0.95 confidence interval.
70
65
60
55
50
45
40
35
30
25
20
Lipid full CVD outcome
Normal
IGT Undiag-
nosed
DM
Known
DM
IFG
Diagnosis WHO criteria
a
b
c
d
a


