CARDIOVASCULAR JOURNAL OF AFRICA • Vol 23, No 1, February 2012
AFRICA
7
10-minute rest period, three readings were taken at five-minute
intervals and the lowest of the three readings was taken as the
blood pressure.
Weight was determined on a Sunbeam EB710 digital bath-
room scale, which was calibrated and standardised using a
weight of known mass. Weight measurements were recorded
to the nearest 0.1 kg and taken with each subject wearing light
clothing, without shoes and socks. Height was recorded in centi-
metres to one decimal place using a stadiometer, with subjects
standing on a flat surface at a right angle to the vertical board
of the stadiometer. Body mass index (BMI) was calculated as
weight per square metre (kg/m
2
).
Waist circumference was measured using a non-elastic tape
at the level of the narrowest part of the torso, as seen from the
anterior view. If it was difficult to see the waist narrowing, espe-
cially in obese subjects, the waist circumference was measured
between the ribs and the iliac crest. All anthropometric measure-
ments were performed three times and the average measure-
ments were used for analysis.
All participants except the self-reported diabetic subjects,
confirmed by either medical card record or drugs in use, under-
went a 75-g oral glucose-tolerance test (OGTT) as prescribed
by the WHO, with fasting blood glucose determinations in
all participants. Categories of glucose tolerance were defined
applying the 1998 WHO criteria.
25
Blood samples were trans-
ported daily in an icebox for processing at the Metropolis private
pathology laboratory (Century City, Cape Town).
Analyses
Plasma glucose was measured by the enzymatic hexokinase
method (Cobas 6000, Roche Diagnostics). Glycosylated haemo-
globin (HbA
1c
) was assessed by turbidimetric inhibition immu-
noassay (Cobas 6000, Roche Diagnostics). High-density lipo-
protein cholesterol (HDL-C) and triglycerides (TG) were esti-
mated by enzymatic colorimetric methods (Cobas 6000, Roche
Diagnostics). Low-density lipoprotein cholesterol (LDL-C) was
calculated using Friedwald’s formula.
Gender-specific prediction for CVD risk was calculated using
the 30-year CVD interactive risk calculator.
16
The calculator
uses standard CVD risk factors (male gender, age, systolic blood
pressure, antihypertensive treatment, diabetes mellitus, total and
HDL-C or BMI instead of lipids to predict two outcomes: hard
CVD (coronary death, myocardial infarction, fatal or non-fatal
stroke) and full CVD (hard CVD or coronary insufficiency,
angina pectoris, transient ischaemic attack, intermittent claudica-
tion or congestive heart failure).
Statistical analysis
Statistical analysis of the data was performed using STATISTICA
(STATISTICA 9, StatSoft Inc 1984–2009). The continuous
variables are presented as median (25th, 75th quartile range)
for asymmetrical data or means ± standard deviation (SD) for
normally distributed data, and categorical variables are expressed
in percentages. For data where the normality assumptions were
suspect, the Mann Whitney U-test was used. The Chi-square test
was used for comparison of categorical variables.
Analysis of covariance, with age as covariate, was used for
the comparison of continuous variables between the subjects
with IFG, IGT, newly diagnosed diabetes, self-reported diabetes
and the control group with normal glucose tolerance. Factorial
ANOVA was used to compare the CVD risk in normal-weight
and obese subjects in the diabetic and non-diabetic subjects.
Best-subset linear regression analysis was done with estimated
30-year Framingham risk as dependent variable. The lipid- and
BMI-dependant equations were compared using intra-class
correlation (ICC) calculated by the R programming language.
Results
A total of 956 subjects participated, comprising 642 random
subjects between the ages of 35 and 65 years and 304 voluntary
TABLE 1. CHARACTERISTICS OF COHORT,
STRATIFIED BY GENDER
Characteristics
Male (
n
=
126)
Female (
n
=
457)
p
Age (years)
47 (40, 55)
46 (39, 53)
0.31
BMI (kg/m
2
)
25.0 (20.8, 29.0)
30.3 (25.9, 35.1)
<
0.0001
WC (cm)*
90.3 (77.8, 100.8) 97.0 (86.5, 108)
<
0.0001
Hip C (cm)*
98 (91, 99)
112 (103, 112)
<
0.0001
SBP (mmHg) * 121 (113, 130)
117 (106, 129)
0.0065
DBP (mmHg)*
76 (70, 85)
74 (67, 83)
0.0372
FBG (mmol/l)
5.3 (4.7, 6.1)
5.4 (5.0, 6.1)
0.2717
PostBG (mmol/l)
6.0 (5.1, 7.9)
6.6 (5.6, 8.2)
0.0068
HbA
1c
(%)
5.7 (5.5, 6.2)
5.7 (5.4, 6.2)
0.7793
TC (mmol/l)
5.2 (4.4, 5.9)
5.5 (4.7, 6.3)
0.0200
TG (mmol/l)
1.29 (0.91, 1.78)
1.19 (0.85, 1.71)
0.2462
HDL-C (mmol/l) 1.13 (0.95, 1.41)
1.21 (1.01, 1.44)
0.0300
LDL-C (mmol/l) 3.23 (2.54, 3.9)
3.56 (2.94, 4.2)
0.0011
Lipid full (%)
41.5 (24, 66)
31 (16, 51)
<
0.0001
Lipid hard (%)
29.5 (15, 52)
17 (8, 32)
<
0.0001
BMI full (%)
46 (27, 61)
32 (18, 53)
<
0.0001
BMI hard (%)
32 (17, 55)
18 (9, 33)
<
0.0001
*Replicated measurements; BMI, body mass index; WC, waist
circumference; Hip C, hip circumference; SBP, systolic blood pres-
sure; DBP, diastolic blood pressure; FBG, fasting blood glucose;
PostBG, post 2-hour blood glucose; TC, total cholesterol; TG,
triglyceride; HDL-C, high-density lipoprotein cholesterol; LDL-C,
low-density lipoprotein cholesterol.
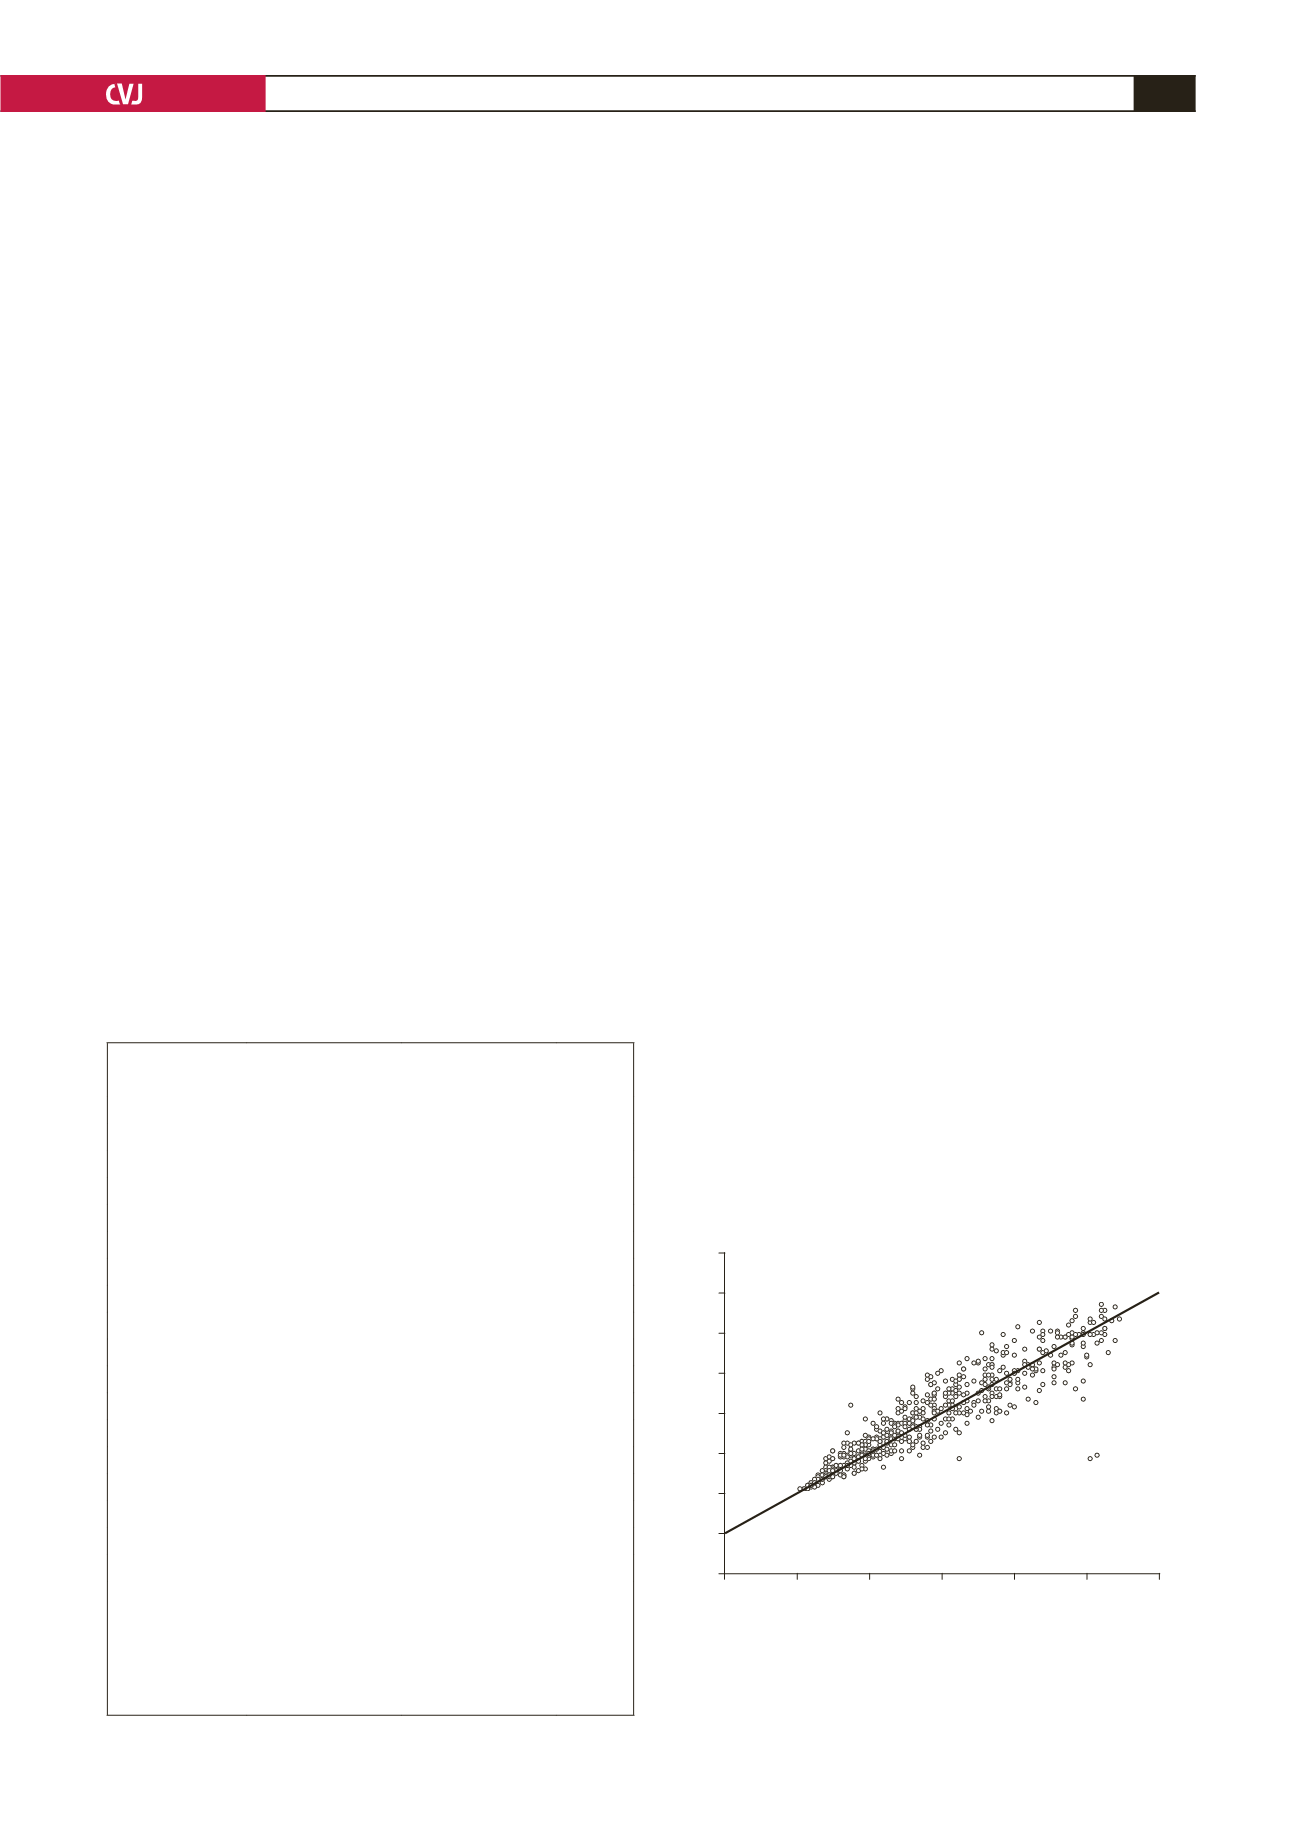
Fig. 1. Intra-class correlation between BMI and lipid-
dependent equation for full CVD outcome. Intra-class
correlation agreement = 0.920, standard error of meas-
urement 6.4%.
120
100
80
60
40
20
0
–20
–40
BMI full CVD outcome
–20
0
20
40
60
80
100
Lipid full CVD outcome


