CARDIOVASCULAR JOURNAL OF AFRICA • Vol 24, No 8, September 2013
300
AFRICA
disease, as reference. The majority (46%;
n
=
29) of the surveyed
supplements cost between R2.01 and R5.00 to attain a 500-mg/
day EPA + DHA intake. Thirty-five per cent (
n
=
22) of the
supplements cost more than R5.00 per day to reach the proposed
n-3 fatty acid intake (Fig. 3). Prices between R26.79 and R61.77
to achieve the daily recommended intake were recorded. Price
increases seem to have been substantial between 2009 and 2012.
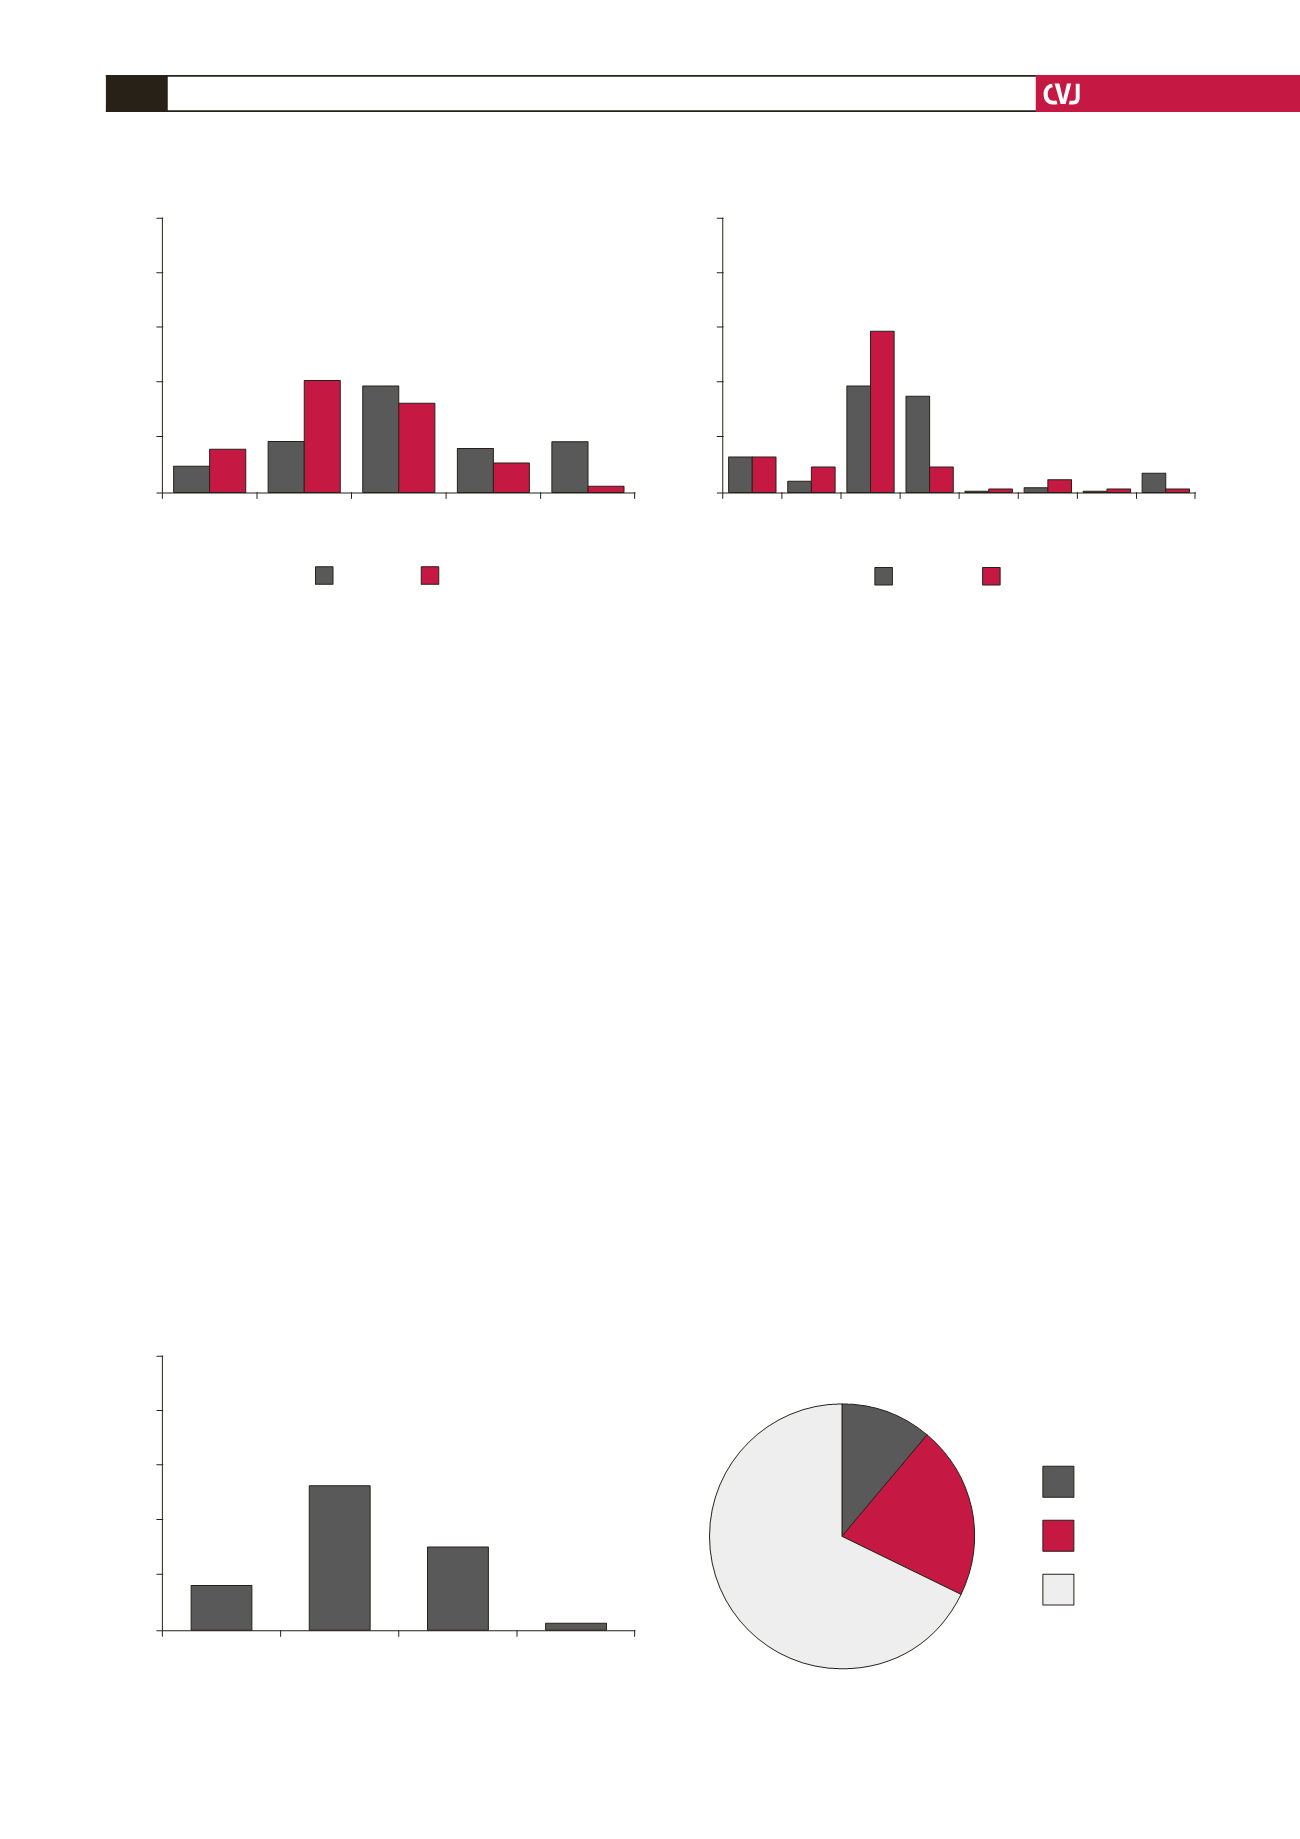
The CD levels of oils are an indication of the early stages
of rancidity of oils. CD levels of
≤
20
μ
mol/g were considered
acceptable. During the 2012 study, 56% (
n
=
33) of the analysed
fish oil supplements contained CD levels within the acceptable
ranges, while 44% (
n
=
26) had CD levels of
>
20
μ
mol/g (Fig. 4).
CD levels of only 59 of the 63 supplements could be
determined due to colour interference with the assay, as CD
levels were determined spectrophotometrically. From the current
analysis it seems that fewer supplements were in the early stages
of rancidity during the 2012 study compared to the 2009 study.
Peroxide levels of
<
5 meq O
2
/kg oil for edible oils are
deemed acceptable, however, the majority (84%;
n
=
48) of the
tested supplements contained peroxide levels higher than the
acceptable range. Merely 16% (
n
=
9) of the fish oil supplements
had peroxide levels within the proposed range (Fig. 5).
Peroxide levels of only 57 of the supplements could be
determined due to colour interference with the assay, as peroxide
levels were determined spectrophotometrically. Peroxide levels
were not determined during the 2009 study.
The majority (81%;
n
=
51) of the supplements under study
had a 1.1–1.5:1 EPA-to-DHA ratio or less (Fig. 6). Only a
few supplements had a 1.5–2.0:1 ratio compared to the results
reported in the 2009 survey.
Fig. 7 shows that almost a third (32%;
n
=
20) of the analysed
fish oil supplements available on the South African market
contained EE or a combination of TG and EE. The form of the
fatty acids was not determined during the 2009 study.
Discussion
The choice of n-3 fatty acid supplements is expanding annually
as more and more manufacturers enter the market. Some fish oil
supplements sold in South Africa are encapsulated locally while
all fish oil or fish oil concentrates are imported from different
countries. Without proper local and international labelling
legislation, in combination with strictly enforced manufacturing
standards, the quality of fish oil supplements as well as the
credibility of their labels remains questionable.
Other countries, for example the US and countries of
the European Union (EU), have strict dietary supplement
labelling legislation but in the US supplements are not subject
to safety and efficacy testing requirements.
18
The EU’s Food
Supplements Directive
19
requires that supplements are obliged to
be demonstrated safe in terms of purity as well as the dosages
recommended. Only supplements proved to be safe may be sold
without a prescription. However, South Africa imports dietary
Fig. 4. Conjugated diene levels of fish oil supplements.
100
80
60
40
20
0
<
10
11–20
21–30
31–40
>
41
Ranges (
µ
mol/g)
Percentage (%)
2009
2012
9%
18%
39%
16%
18%
15%
41%
32%
10%
2%
Fig. 5. Peroxide levels of fish oil supplements.
100
80
60
40
20
0
<
5
6–10
11–30
>
30
Ranges (meq O
2
/kg oil)
Percentage (%)
n
=
9
n
=
30
n
=
17
n
=
1
Fig. 6. EPA-to-DHA ratio in the surveyed n-3 fatty acid
supplements.
100
80
60
40
20
0
<
0.5
0.6–1.0 1.1–1.5 1.6–2.0 2.1–2.5 2.6–3.0 3.0–3.5
>
5
Ratio EPA:DHA
Percentage (%)
2009
2012
13%
4%
39%
35%
0% 2% 0%
7%
13%
10%
59%
10%
2% 5% 2% 2%
Fig. 7. Form of n-3 fatty acids present in the surveyed
supplements.
TG
EE
TG
+
EE
n
=
63
n
=
43
68%
n
=
7
11%
n
=
13
21%


