CARDIOVASCULAR JOURNAL OF AFRICA • Vol 24, No 8, September 2013
AFRICA
299
After drying under a stream of nitrogen, fatty acids were
trans-methylated with methanol-sulphuric acid (5% sulphuric
acid in anhydrous methanol) for two hours at 70°C. Fatty acid
methyl esters were extracted with hexane and analysed by gas–
liquid chromatography (GLC, Thermo, Focus) equipped with
a flame ionisation detector and a 60-meter BPX 70 capillary
column. Oven temperature was programmed at 2°C per minute
from 160 to 220°C.
Fatty acids were quantified by comparing the areas of
a specific fatty acid with that of the internal standard and
correcting for the relative response factor for the specific
acid. Total fatty acids were calculated and each fatty acid was
expressed as a percentage of the total fatty acids. The values so
obtained were then translated into the amount of fatty acid per
capsule.
Determination of triglyceride and ethyl ester
contents
The content of all fish oil capsules were screened for neutral lipid
and EE content by high-performance thin-layer chromatography
(HPTLC) using 10 × 10-cm silica gel 60 plates (Merck). Plates
were developed with hexane–diethyl ether–acetic acid (85:15:2
by volume).
16
Ten micro-samples (10
μ
l), prepared for GLC
analysis of fatty acid, were applied to plates as a single spot.
Samples of EE of fatty acids and fatty acid TG were applied
for identification. Lipids were identified by spraying with
2,5-Bis (5-tert-butyl-benzoxazol-2-yl) thiophene and visualised
under UV light. Individual spots were scraped off the plate
and eluted with chloroform methanol. TG spots were trans-
methylated with methanol sulphuric acid, where after EE spots
were confirmed by GC-MS analysis.
Results
Measured EPA and DHA contents of fish oil supplements
were compared to the contents claimed on the product labels.
A reference range between 90 and 110% of the manufacturers’
claimed contents for EPA and DHA was proposed. Supplements
containing
≤
89% of the claimed EPA and/or DHA were
considered substandard, while those containing
≥
110% EPA
and/or DHA were considered to be in surplus.
CD contents of the fish oils were compared to levels as
described by Opperman
et al.
13
For peroxide contents, values
≤
5 meq O
2
/kg oil were deemed acceptable as recommended by
the Global Organisation for EPA and DHA Omega-3 (GOED).
17
Results of the 2012 study were compared to the results of a
similar study conducted in 2009 to determine if there was any
improvement in the accuracy of labelling information, the level
of rancidity, and the EPA-to-DHA ratios of the supplements.
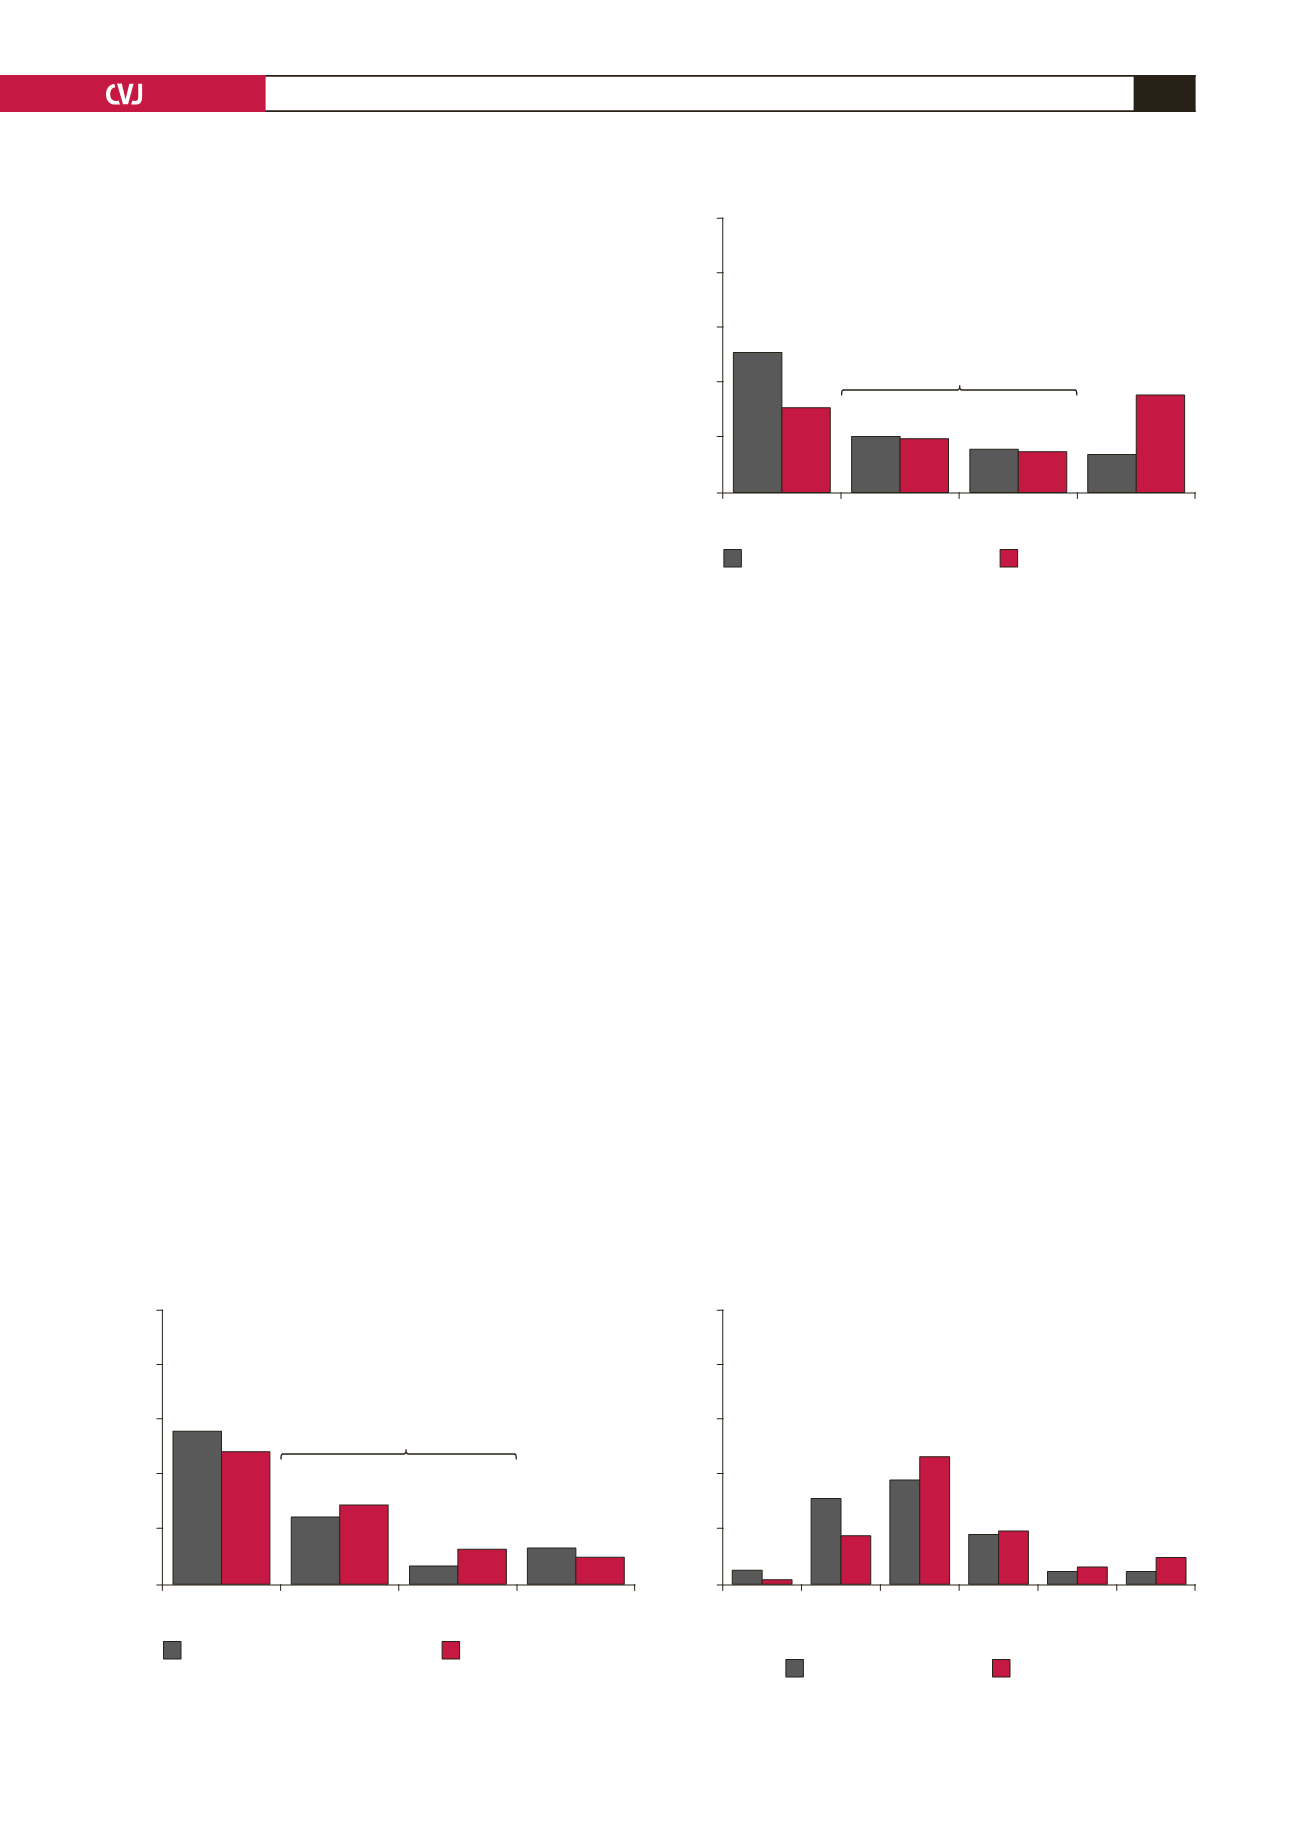
Comparison of measured versus claimed contents against the
acceptable ranges (Fig. 1) indicated that almost half (
n
=
30;
48%) of the studied supplements failed to meet the claimed EPA
requirements (2012). This is a small improvement compared to
the 2009 analysis.
For DHA, 31% (
n
=
19) of the supplements did not meet the
proposed DHA requirements (Fig. 2) compared to the 51% in
the 2009 study. Thirty-five per cent (
n
=
22) of the supplements
contained more than 110% of the DHA claimed on the product
label. For the current EPA and DHA analysis, data of only 62
supplements could be recorded because one of the supplements
did not provide any information on the label about the EPA and
DHA content of the product.
In the absence of n-3 fatty acid dietary recommendations
for South Africa, we used the ISSFAL
18
recommended intake of
500 mg/day EPA + DHA for the prevention of cardiovascular
Fig. 1. Measured versus claimed contents of EPA (*accept-
able range 90–110%).
100
80
60
40
20
0
<
89%
90–99% 100–110%
>
110%
Ranges
Percentage (%)
% claimed EPA 2009
% claimed EPA 2012
56%
48%
24%
7%
13%
29%
13%
10%
*
Fig. 2. Measured versus claimed contents of DHA
(*acceptable range 90–110%).
100
80
60
40
20
0
<
89%
90–99% 100–110%
>
110%
Ranges
Percentage (%)
% claimed DHA 2009
% claimed DHA 2012
51%
31%
20%
16%
13%
19%
15%
35%
*
Fig. 3. Price to attain 500 mg/day EPA
+
DHA.
100
80
60
40
20
0
<
R1.00
R1.01–
R2.00
R2.01–
R5.00
R5.01–
R10.00
R10.01–
R15.00
>
R15.00
Price range (R)
Percentage (%)
Prices in 2009
Prices in 2012
5%
31%
38%
18%
4%
4%
2%
17%
46%
19%
6% 10%


