


 10 / 64

S8
AFRICA
CVJAFRICA • Volume 26, No 2, H3Africa Supplement, March/April 2015
between 1990 and 2013, however, likely due to aging and growth
of the SSA population, the number of IHD deaths increased by
87% over the same interval (Table 1).
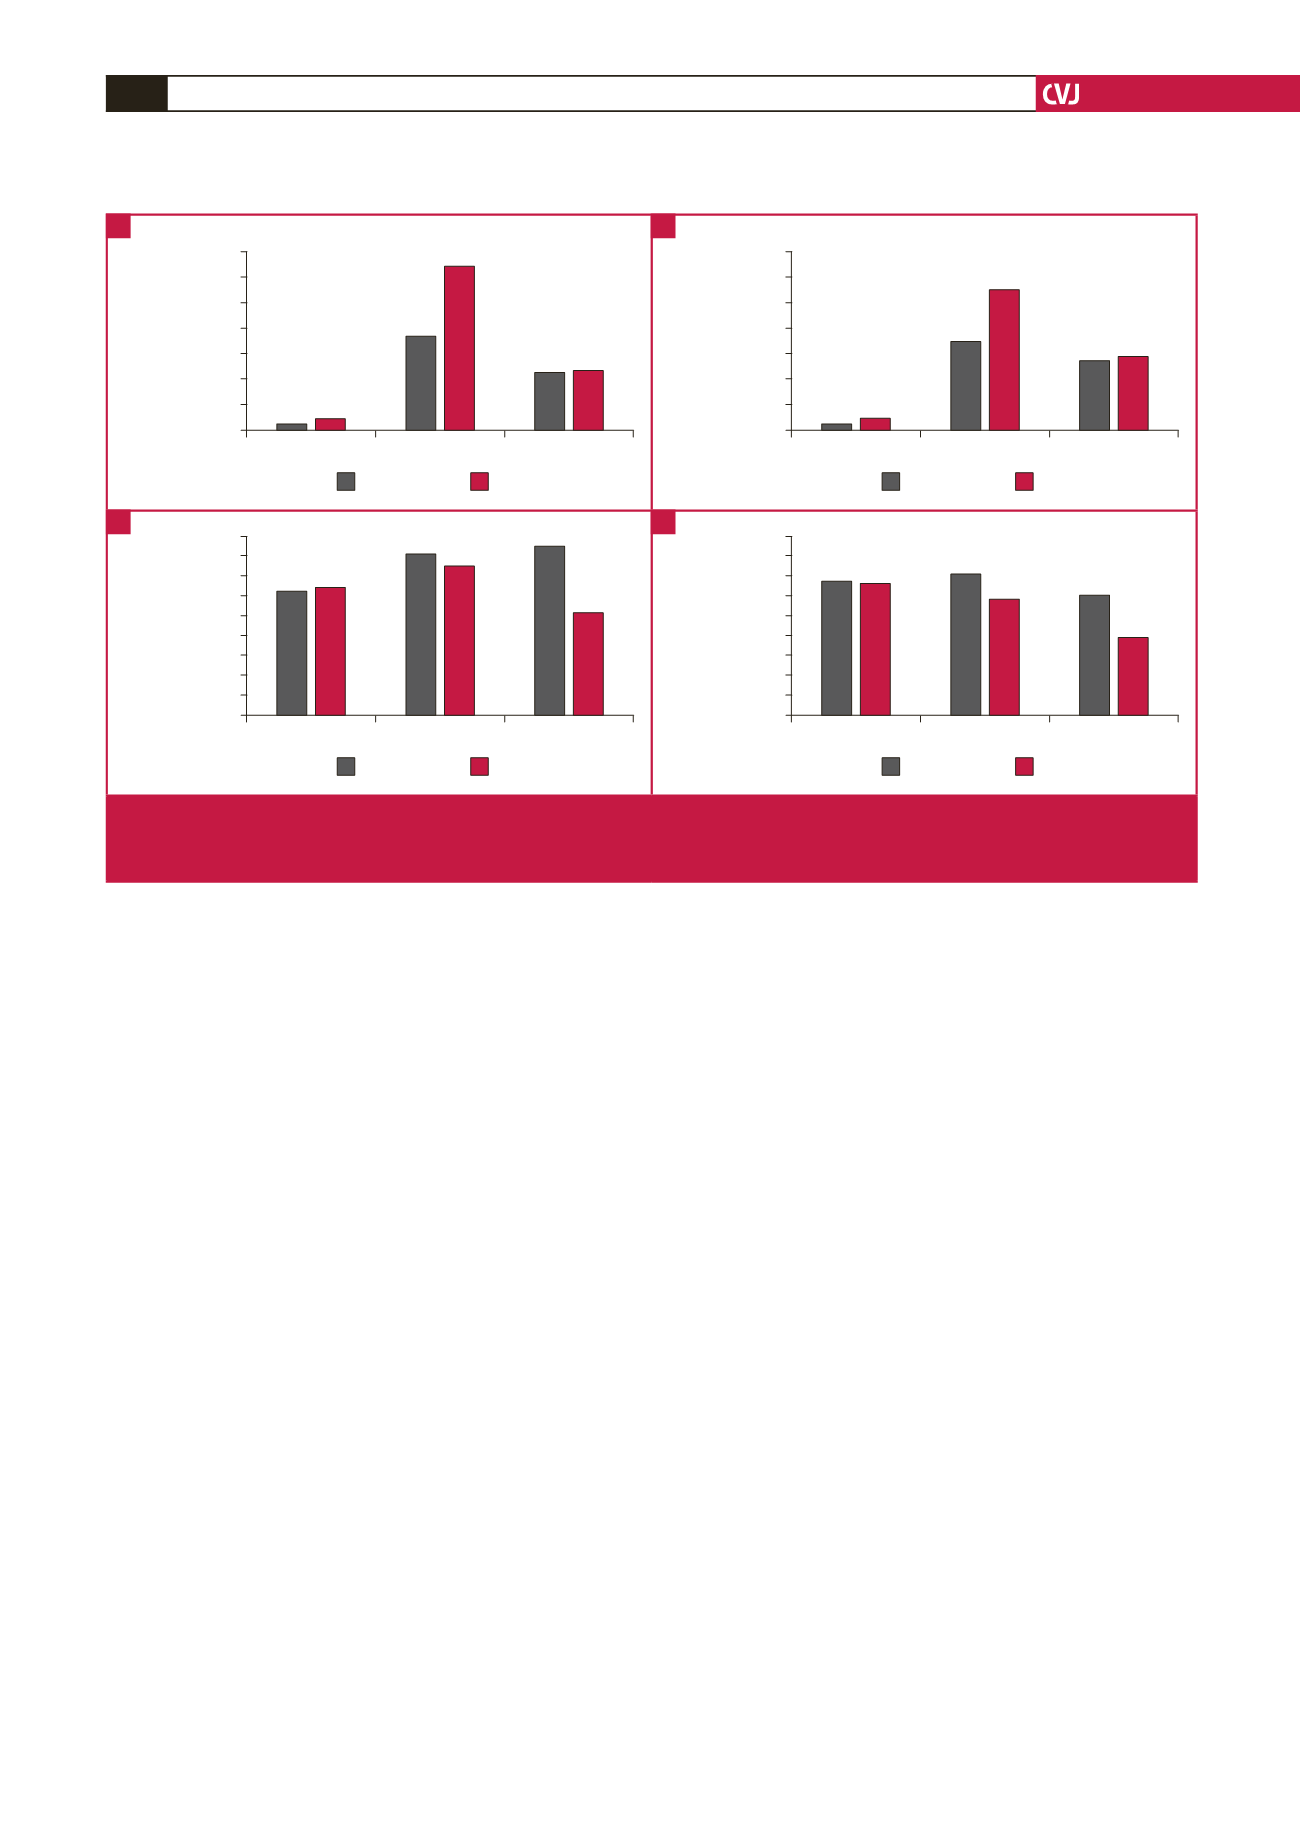
As shown in Fig. 1 for both men and women, the number
of CVD deaths in SSA was substantially lower than that seen
for either the developed or developing countries. Contrary to
the pattern seen for developed and developing countries (as a
whole), the age-standardised mortality rate for CVD in both men
and women in SSA did not decline during the period from 1990
to 2013 (Fig. 1). In fact, the age-standardised mortality rate for
women in SSA, which was lower than the corresponding rate in
women in developing countries in 1990, is now higher than the
rate seen for women in developing countries, and substantially
higher than the corresponding rates for both men and women in
the developed world (Fig. 1).
The number of deaths from stroke in SSA nearly doubled
from 1990 to 2013, but overall age-adjusted stroke mortality
rates decreased by 1% (increased by 9% for ischaemic stroke
and decreased by 10% for haemorrhagic stroke). The increase
in number of stroke deaths in SSA was particularly noticeable
for ischaemic stroke (104% increases in 2013 compared to 1990),
although age-adjusted stroke mortality rates in SSA regions were
one of the lowest in LMIC and only slightly higher than that in
developed countries, compared with GBD 2010 stroke mortality
estimates. Although the majority of deaths from stroke in SSA
in 1990 were due to haemorrhagic strokes (55%), in 2013 the
proportional frequency of deaths from haemorrhagic stroke
was slightly lower (49.6%) than that from ischaemic stroke.
Compared to GBD 2010 stroke mortality estimates, the mean
age at death from stroke in SSA was the lowest among all LMIC.
In 1990 the total number of deaths from PAD was 469
(CI: 371–580) compared with 1 338 (CI: 1 122–1 618) in 2013,
representing a 185% increase. There were 277 (CI: 204–366)
deaths due to PAD among men, which was higher than the 192
(CI: 145–271) deaths observed among women. Similarly, in 2013,
the number of PAD deaths among men was 728 (CI: 578–902),
which was also higher than the 610 (CI: 480–817) deaths
observed among women. The combined age-standardised death
rates per 100 000 were 0.4 (CI: 0.3–0.5) and 0.6 (CI: 0.5–0.7) in
1990 and 2013, respectively, representing a 50% increase during
the 23-year period. The age-standardised death rates for men
were 0.5 (CI: 0.3–0.6) in 1990 and 0.6 (CI: 0.5–0.8) in 2013, which
represents a 20% increase. However, women had a 66% increase
in age-standardised death rates, as evidenced by the change from
0.3 (CI: 0.2–0.5) in 1990 to 0.5 (CI: 0.4–0.7) in 2013.
The total number of deaths from atrial fibrillation was 414
(331–509) in 1990, compared with 1 227 (CI: 959–1 558) in 2013,
representing an increase of 196%. However, the age-standardised
death rates (per 100 000) increased by 50% during the study
period from 0.4 (CI: 0.3–0.5) in 1990 to 0.6 (CI: 0.5–0.8) in
2013. In 1990 there were 148 (CI: 106–193) deaths due to
atrial fibrillation among men, which was less than the 266
(CI: 201–347) deaths observed among women. In 2013 there
was a similar pattern of fewer AFIB deaths in men compared
with women: 378 (CI: 295–490) vs 848 (CI: 605–1 170). The
age-standardised death rates for men were 0.3 (CI: 0.2–0.4) in
1990 and 0.4 (CI: 03–0.5) in 2013. The corresponding rates for
women were 0.5 (CI: 0.3–0.7) and 0.7 (CI: 0.5–1.0), respectively.
The mortality rate from PAD in SSA has increased over the
last 23 years. Furthermore, the relative increase in PAD mortality
rate among women has been more dramatic than among men.
Similar findings are noted for AFIB, wherein we actually
observed a higher number of deaths and age-standardised death
rates among women compared with men.
Sub-Saharan Africa Developing countries Developed countries
7 000 000
6 000 000
5 000 000
4 000 000
3 000 000
2 000 000
1 000 000
0
Frequency
1990
2013
Frequency
Sub-Saharan Africa Developing countries Developed countries
7 000 000
6 000 000
5 000 000
4 000 000
3 000 000
2 000 000
1 000 000
0
1990
2013
Death rates
Sub-Saharan Africa Developing countries Developed countries
450
400
350
300
250
200
150
100
50
0
1990
2013
Death rates
Sub-Saharan Africa Developing countries Developed countries
450
400
350
300
250
200
150
100
50
0
1990
2013
Fig. 1.
Number of CVD deaths in men (A) and women (B) in 1990 and 2013 in sub-Saharan Africa, developing countries, and in
developed countries. Age-standardised CVD death rates per 100 000 population are shown for men (C) and women (D) in
1990 and 2013 in sub-Saharan Africa, developing countries, and in developed countries.
A
C
B
D