CARDIOVASCULAR JOURNAL OF AFRICA • Vol 23, No 6, July 2012
314
AFRICA
level
>
20 mmol/l). Patients with an acute coronary syndrome of
less than 48 hours and those unable to undertake a stress study
because they were unfit were also excluded.
Measurement of homocysteine
Prior to stressing, venous blood was obtained from the fasting
patients and immediately sent to the laboratory where it was
centrifuged and frozen. Total homocysteine level was determined
by enzymatic assay and by Abbott florescence polarisation
immunoassay. This method has been shown to correlate well
with both gas chromatography–mass spectrometry and high-
performance liquid chromatography (HPLC) methods.
12
Elevated homocysteine level was defined as plasma level
>
12
µ
mol/l. The homocysteine results were not known at the time of
analysis of the myocardial perfusion scintigraphy.
Stress protocol
All patients were imaged using the department’s standard two-day
99m
TcMIBI protocol. Patients were stressed physically on a bicycle
ergometer or with pharmacological agents. Pharmacological
stress was performed using an infusion of 0.14 mg/kg/min
dipyridamole combined with four minutes of low-level exercise.
Dobutamine stress was used in patients who could not undergo
exercise stress or dipyridamole pharmacological stress. At peak
stress, 555 MBq
99m
Tc MIBI was administered, with a similar
activity used for the resting imaging.
Image acquisition and interpretation
Tomographic images were acquired on a dual-headed gamma
camera (Siemens ECAM, Erlangen, Germany). A low-energy,
high-resolution collimator was used for acquisition with a
140-Kev photopeak and 15% window. A 180° non-circular (body
contour) orbit was used.
Images were processed using E soft and 4 DM SPECT
processing software (Siemens, Erlangen, Germany) for visual
display and quantitative analysis. The summed stress score
(SSS), summed rest score (SRS), stress end-systolic volume
(SESV) and post-stress left ventricular ejection fraction (SEF)
were obtained. The SSS and SRS were categorised into normal,
mild, moderate and severe categories using the American College
of Cardiology/American Society of Nuclear Cardiology (ACN/
ASNC) standard 17-segment model of the left ventricle, and
their scoring model and criteria for classification of perfusion.
13
Statistical analysis
The data were collected into an excel worksheet and STATA
11 software (Microsoft, Redmond, USA) was used to find any
univariate and multivariate correlation between the factors
measured. Patients were also divided into two groups depending
on whether homocysteine level was raised or not, and compared
using a two-tailed paired Students
t
-test with a significance level
of
p
<
0.05.
Non-parametric data between those with and without raised
homocysteine levels were compared using a Chi-square test.
The plasma homocysteine level was also log transformed and
correlated with the SSS and SRS and compared with different
sub-groups derived from the collected data.
Results
Of the 120 patients enrolled in the study, 63 (53%) were male.
The mean and median age was 56 years (Table 1). Elevated
plasma homocysteine levels (
>
12
µ
mol/l) were present in 39
patients (33%). In addition, 38 (32%) patients had diabetes
mellitus, 94 (78%) had a history of hypertension, 59 (49%)
had dyslipidaemia and 20 (17%) had a significant history
of smoking. The group studied was representative of the
patient demographics of patients who are referred for suspected
myocardial ischaemia at the Steve Biko Academic Hospital,
Pretoria.
Using the criteria of gender and age to determine which
patients were considered to be at higher risk for CAD, i.e. males
older than 45 years and females older than 55 years, 88 (73%)
patients were considered to be at higher risk for CAD. However,
there was no effect of the patient’s age on normal or elevated
homocysteine levels (Table 1).
The presence of any single individual risk factor did not
have a good correlation with plasma homocysteine levels.
However the number of risk factors for CAD in an individual
patient demonstrated a significant correlation with a raised
homocysteine level (
p
=
0.038), such that when four risk factors
were present, 61% of patients had an abnormal homocysteine
level (Table 2).
Those patients with a raised homocystiene level had a
significantlyhigherSSSandSESVcomparedtothosewithanormal
homocytsiene level (Table 3). The SEF was also significantly
lower in those patients with a raised homocysteine level.
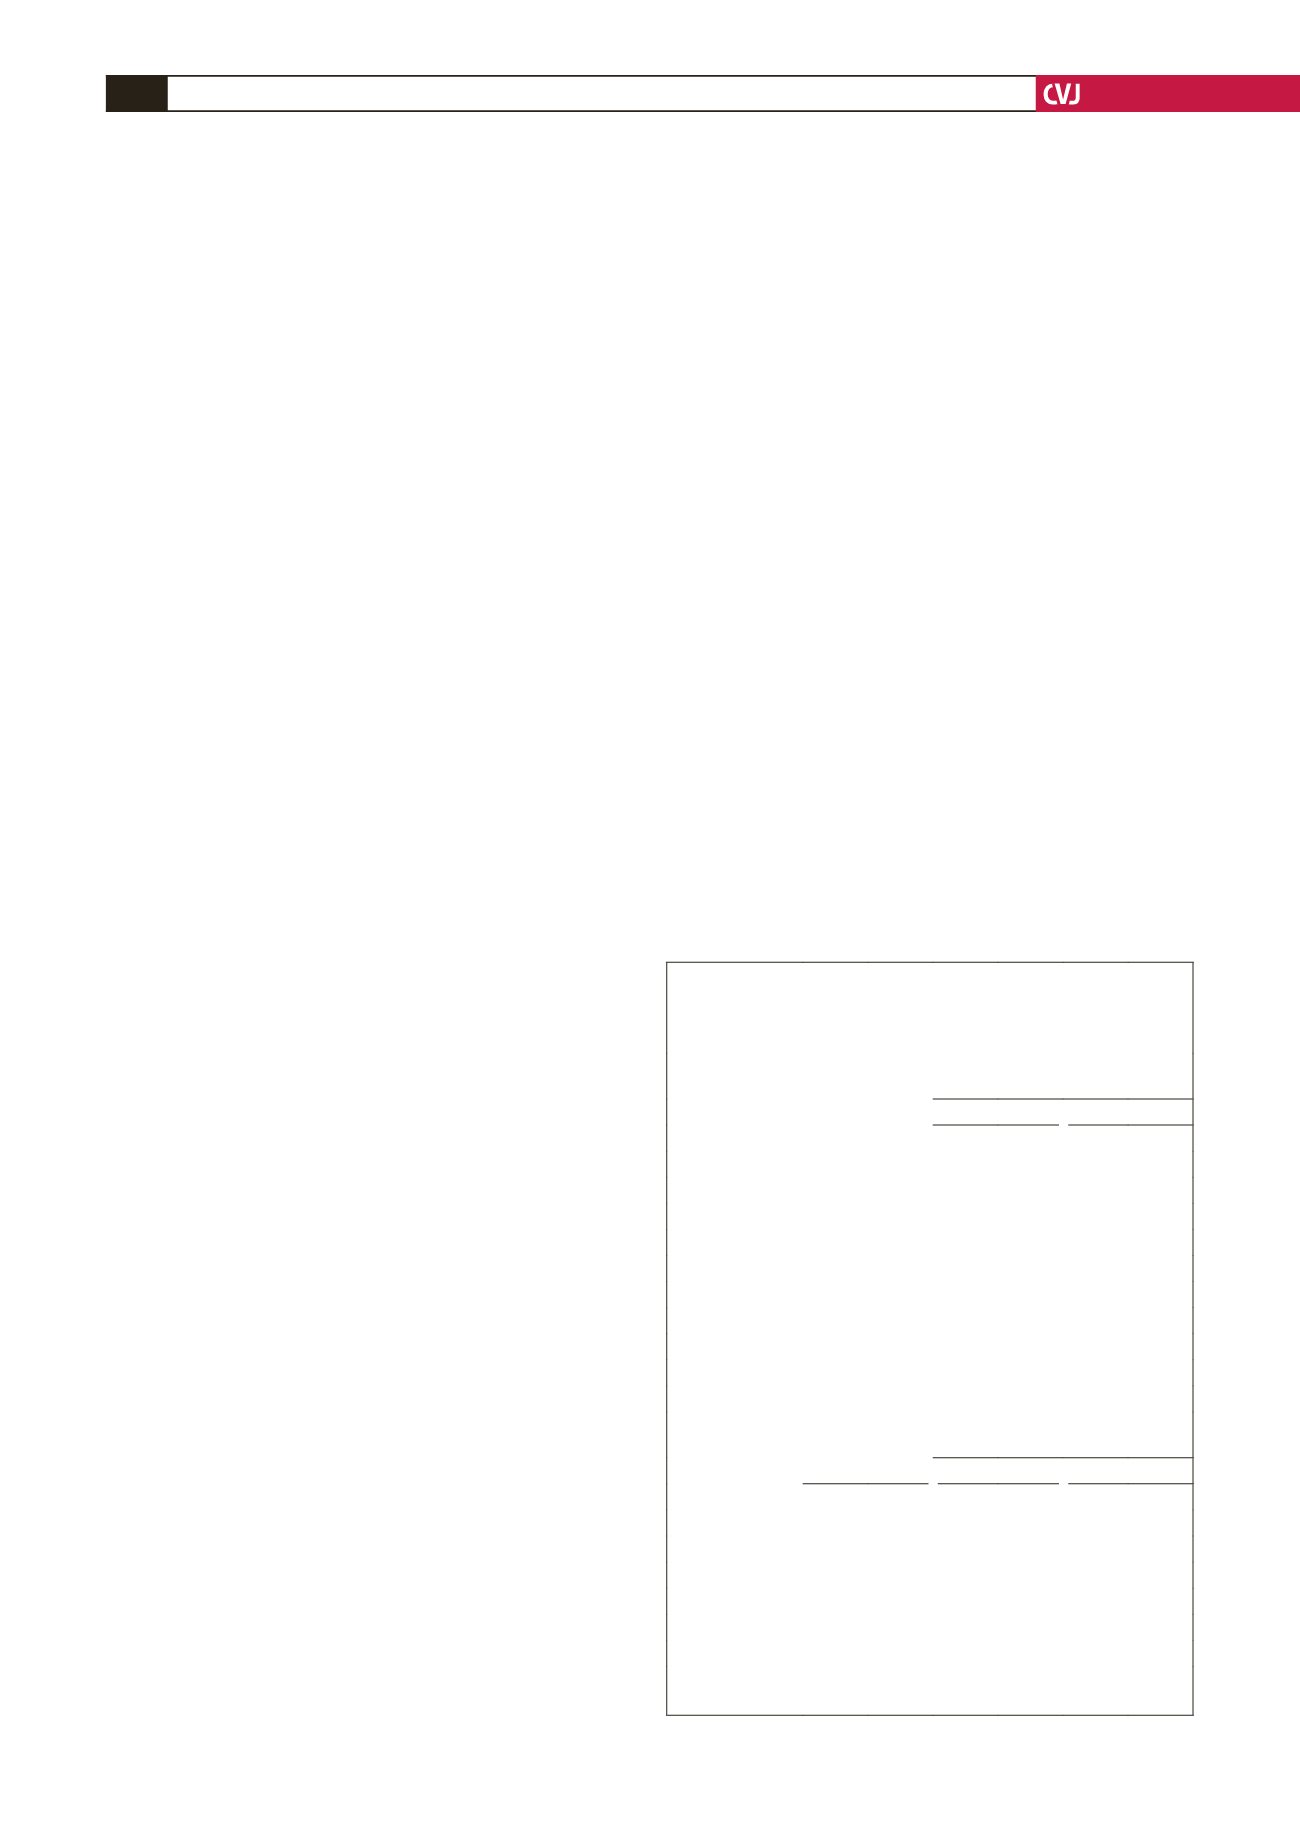
TABLE 1. DEMOGRAPHYAND RISK FACTORS FOR
PATIENTSWITHA CORRELATION BETWEEN SUMMED
STRESS SCORE (SSS) AND SUMMED REST SCORE (SRS)
AND ELEVATED HOMOCYSTEINE LEVELS
Demography
n
%
Correlation of log
homocysteine levels and
SSS
SRS
r
p
r
p
Male
63
53 –0.028
ns
0.059 ns
Female
57
47 0.029 ns –0.003
ns
Age (years)
26–49
30
25 0.004 ns
0.120 ns
50–64
60
50 0.279 0.03 0.135 ns
65–84
30
25 –0.246 ns
0.014 ns
Racial origin
Caucasian
77
64 –0.02 ns –0.022 ns
Coloured
23
19 0.308 ns
0.373 ns
African
20
17 –0.022 ns –0.082 ns
CAD risk factors
Patients with
raised
homocysteine
Correlation of
homocysteine levels and
SSS
SRS
n
% r
p
r
p
Diabetes mellitus
38
32 0.055 ns
0.092 ns
Hypertension
94
78 0.155 ns
0.119 ns
Smoker
20
17 0.278 ns
0.073 ns
Dyslipidaemia
59
50 0.120 ns
0.085 ns
Age and gender
88
73 0.133 ns
0.097 ns
Total
120 100 0.077 ns
0.096 ns
CAD
=
coronary artery disease,
r
=
correlation coefficient,
p
=
significance, ns
=
not significant.


