CARDIOVASCULAR JOURNAL OF AFRICA • Vol 23, No 8, September 2012
460
AFRICA
regarding BP control or staging of current hypertensive status
for uncontrolled individuals; (2) for patient sub-populations with
undetermined hypertensive status (commonly encountered in
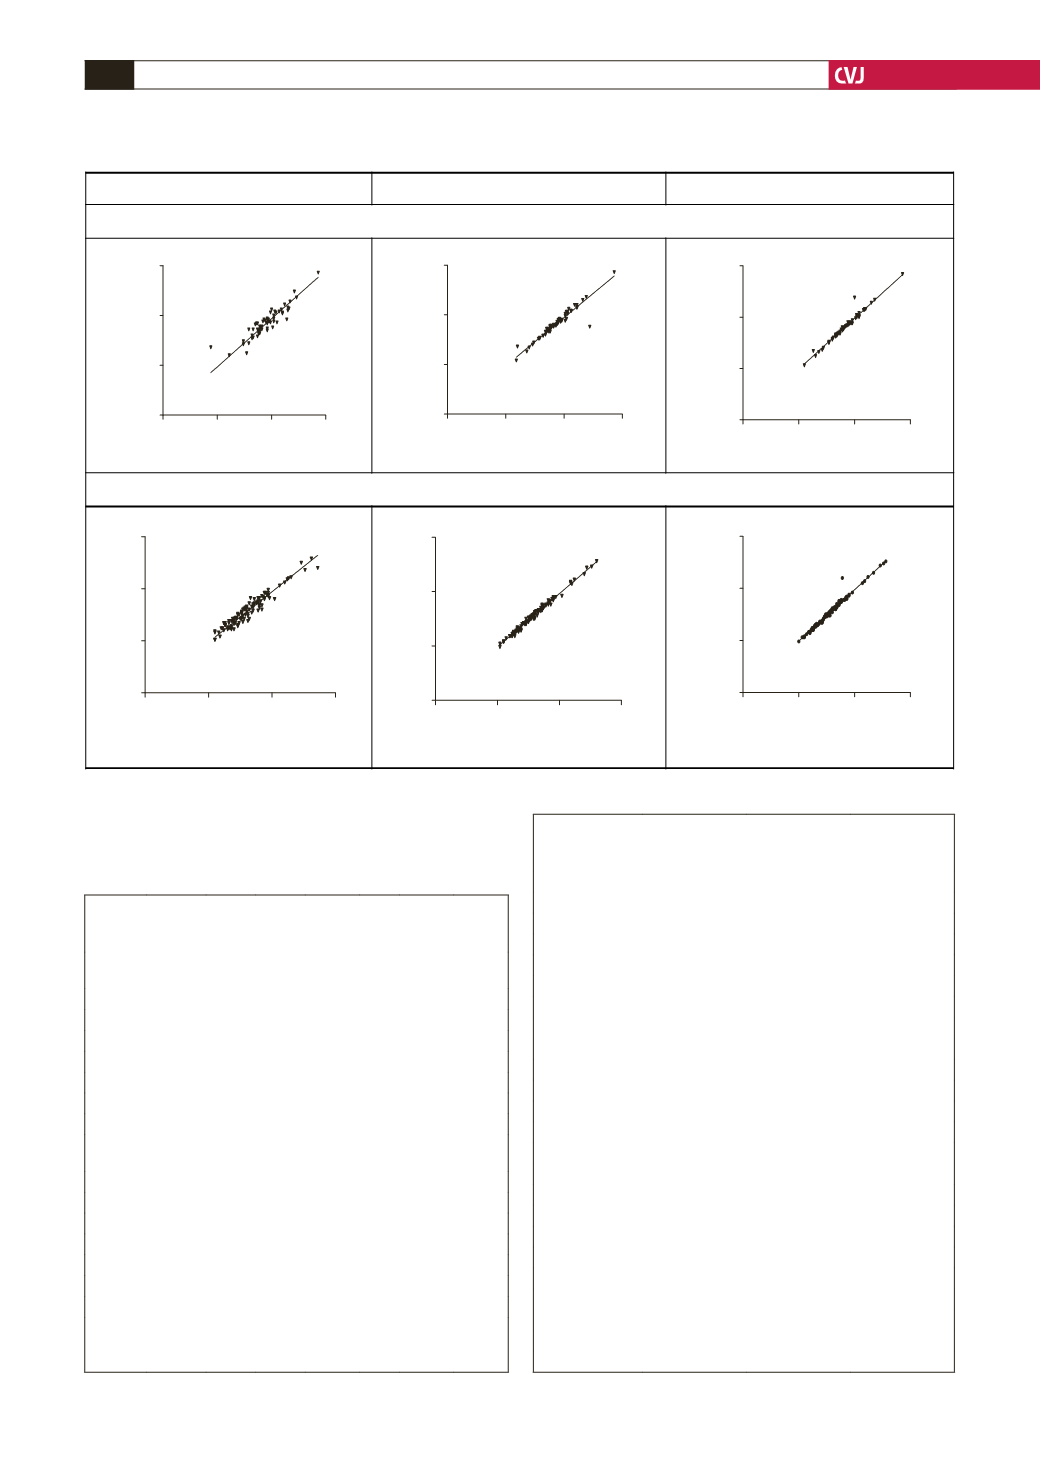
Fig. 2. Correlation scatter plots and coefficients for compared diastolic readings.
Single readings
Average of 3 readings
Average of 5 readings
Hypertensive sub-population (
n
= 61)
Mixed sub-population (
n
= 109)
0
50
100
150
0
50
100
150
r = 0.91 (0.86-0.95 )
p <0.0001
Dia 1 (mmHg)
Dia 2 (mmHg)
0
50
100
150
0
50
100
150
Dia
1-3
(
mmHg)
Dia
2-4
(
mmHg)
r = 0.95 (0.91- 0.97)
p< 0.0001
0
50
100
150
0
50
100
150
Dia
1-5
(
mmHg)
Dia
2-6
(
mmHg)
r = 0.98 (0.97-0.99)
p < 0.0001
0
50
100
150
0
50
100
150
Dia 1 (mmHg)
Dia 2 (mmHg)
r = 0.96 (0.95 - 0.98)
p < 0.0001
0
50
100
150
0
50
100
150
Dia
1-3
(
mmHg)
Dia
2-4
(
mmHg)
r = 1.00 (0.99-1.00)
p < 0.0001
0
50
100
150
0
50
100
150
r = 0.99 (0.98-0.99)
p < 0.0001
Dia
1-5
(
mmHg)
Dia
2-6
(
mmHg)
TABLE 3. DISTRIBUTION OF BLOOD PRESSURE
READINGS FROM COMPAREDVARIABLES USING
CLASSICALAND MODIFIED JNC-7 MODELS
Variables Optimal
Pre-
HTN Stage I Stage II ISH
χ
2
(4
df)
p
-
value
Mixed sub-population (
n
=
109)
FBPR 37
30
14
14 14 1.37 0.84
SBPR 43
28
11
16 11
AVE
1–3
41
34
12
10 12 2.10 0.72
AVE
2–4
45
37
6
10 11
AVE
1–5
43
37
9
9
11 0.45 0.93
AVE
2–6
48
35
7
10
9
Variables
Stage 0
Stage I Stage II ISH
χ
2
(3
df)
p
-
value
Hypertensive sub-population (modified JNC-7 model) (
n
=
61)
FBPR
11
9
30 11 0.37 0.95
SBPR
13
9
27 12
AVE
1–3
13
11
25 12 1.02 0.80
AVE
2–4
16
8
23 14
AVE
1–5
17
11
21 12 0.46 0.93
AVE
2–6
16
11
19 15
Pre-HTN
=
pre-hypertension; ISH
=
isolated systolic hypertension,
χ
2
(4
df)
=
Chi-square test with 4 degrees of freedom,
χ
2
(3
df)
=
Chi-square
test with 3 degrees of freedom.
TABLE 4. COMPARISON OF THE DISTRIBUTION
OF BLOOD PRESSURE READINGS RELATIVE TO
A THRESHOLDVALUE OF 140/90 mmHg
Variables
<
140/90
mmHg
≥
140/90
mmHg
p
-
value*
Final study population (
n
=
170)
FBPR
79
91
SBPR
86
84
0.52
AVE
1–3
88
82
AVE
2–4
97
73
0.38
AVE
1–5
96
74
AVE
2–6
100
70
0.74
Mixed sub-population (
n
=
109)
FBPR
67
42
SBPR
71
38
0.67
AVE
1–3
75
34
AVE
2–4
82
27
0.37
AVE
1–5
80
29
0.76
AVE
2–6
83
26
Controlled
Uncontrolled
Hypertensive sub-population (
n
=
61)
FBPR
11
50
0.82
SBPR
13
48
AVE
1–3
13
48
0.67
AVE
2–4
16
45
AVE
1–5
17
44
1.00
AVE
2–6
16
45
*
Fisher’s exact test.


