CARDIOVASCULAR JOURNAL OF AFRICA • Vol 23, No 8, September 2012
AFRICA
459
measurement model, the hypertensive sub-population had higher
proportions of clinically significant differences (
≥
5
mmHg)
between the compared readings than the mixed sub-population.
However, the differences between the sub-populations in the
proportion of differences (
≥
5
mmHg) were not statistically
significant.
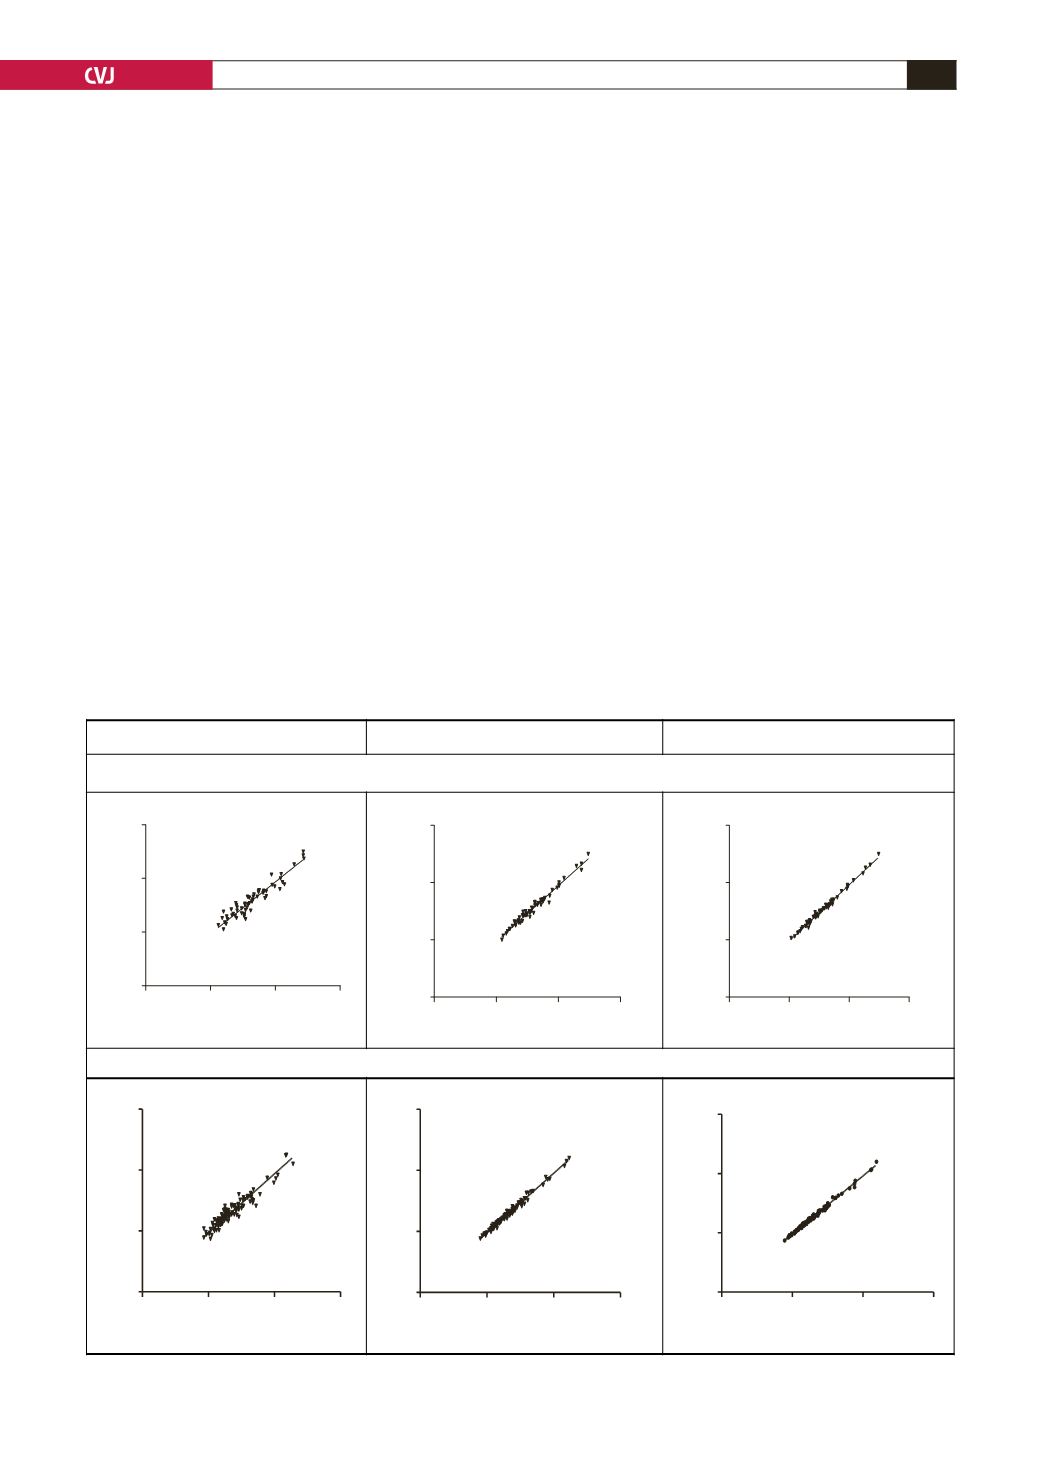
Systolic and diastolic readings that included FBPR had strong
statistically significant correlations to those excluding FBPR
[
Pearson’s correlation coefficient (
r
) 0.86–1.00,
p
<
0.0001
for
all pairs of comparisons]. Scatter plots depicting these strong
correlations as well as their coefficients (and 95% confidence
intervals for the correlation coefficients) are shown in Figs 1 and
2
for systolic and diastolic readings, respectively.
The distributions of the subjects’BP in the JNC-7model (mixed
sub-population) and a modified JNC-7 model (hypertensive
sub-population) are shown in Table 3. No statistically significant
difference was found in the pattern of distribution between the
readings in all the comparisons within each sub-group.
Table 4 shows the changes in the distribution of subjects’ BP
relative to a threshold value of 140/90 mmHg. It was observed
that in the final study population, hypertensive sub-population
and mixed sub-population, respectively, non-statistically
significant differences were obtained in the distribution of BP
values into
<
140/90
mmHg and
≥
140/90
mmHg groups by
readings inclusive or exclusive of FBPR (
p
>
0.05
for all, Fisher’s
exact tests).
Discussion
In this study, comparative analysis was used to evaluate the
effect of the first office BP reading on hypertension-related
clinical decisions using single, triple and quintuple measurement
models. Our results showed that mean readings that included or
excluded FBPR (systolic and diastolic, respectively) within the
final study population and the sub-populations did not differ in
statistical significance.
The distribution of blood pressure readings for the hypertensive
and mixed sub-populations in the classes defined by the JNC-7
model or its modification did not reveal any statistically
significant difference relating to inclusion or exclusion of the
FBPR for single, triple or quintuple measurements. Similarly, the
distribution of the analysed blood pressure readings relative to a
threshold of 140/90 mmHg did not differ significantly between
readings that included or excluded FBPR.
A non-statistically significant difference was found between
the hypertensive and mixed sub-populations in the comparison of
the proportions of differences between readings that included and
excluded the FBPR, which were: clinically significant (
≥
5
mmHg);
and 0 mmHg. Lastly, we found that readings that included the
FBPR were strongly correlated to those excluding the FBPR.
Overall, our findings suggest that: (1) for patient populations
with known hypertensive status, the use of FBPR as a single
reading or its inclusion in repeated readings for deriving average
BP values may not have a significant effect on clinical decisions
Fig. 1. Correlation scatter plots and coefficients for compared systolic readings.
Single readings
Average of 3 readings
Average of 5 readings
Hypertensive sub-population (
n
= 61)
Mixed sub-population (
n
= 109)
0
100
200
300
0
100
200
300
r = 0.95 ( 0.91-0.97 )
p <0.0001
Sys 1 (mmHg)
Sys 2 (mmHg)
0
100
200
300
0
100
200
300
Sys
1-3
(
mmHg)
Sys
2-4
(
mmHg)
r = 0.99 (0.98-0.99)
p <0.0001
0
100
200
300
0
100
200
300
Sys
1-5
(
mmHg)
Sys
2-6
(
mmHg)
r = 1.00 ( 0.99 - 1.00 )
p < 0.0001
0
100
200
300
0
100
200
300
Sys 1 (mmHg)
Sys 2 (mmHg)
r = 0.95 ( 0.93-0.97 )
p < 0.0001
0
100
200
300
0
100
200
300
Sys
1-3
(
mmHg)
Sys
2-4
(
mmHg)
r = 0.99 (0.99-1.00)
p < 0.0001
0
100
200
300
0
100
200
300
r =1.00 (0.99-1.00)
p <0.0001
Sys
1-5
(
mmHg)
Sys
2-6
(
mmHg)


