CARDIOVASCULAR JOURNAL OF AFRICA • Vol 23, No 8, September 2012
AFRICA
449
showed the D-dimer test to be less sensitive (semi-quantitative
latex agglutination D-dimer assay with 78% sensitivity). It also
demonstrated that patients with PTE had fibrinogen levels within
the normal range (200–400 mg/dl). However, the sample size of
the study was small compared to other studies in this field (40
cases).
26
The aim of our study was to determine whether there was
an inverse relationship between D-dimer and fibrinogen levels.
The theory was that while the activation of the coagulation
cascade consumes fibrinogen in the pulmonary vasculature to
form fibrin, the activation of fibrinolysis results in elevated
fibrin degradation products such as D-dimer.
9
This theory may
be applicable in acute PTE without complications and for any
other factor that may influence D-dimer and fibrinogen (as an
acute-phase reactant) concentrations in out-patients. In patients
with other complications, these biomarkers will be different.
11-15
We hypothesised that the conditions influencing D-dimer
and fibrinogen levels would magnify the difference between
these biomarkers when combined, and therefore lead to a more
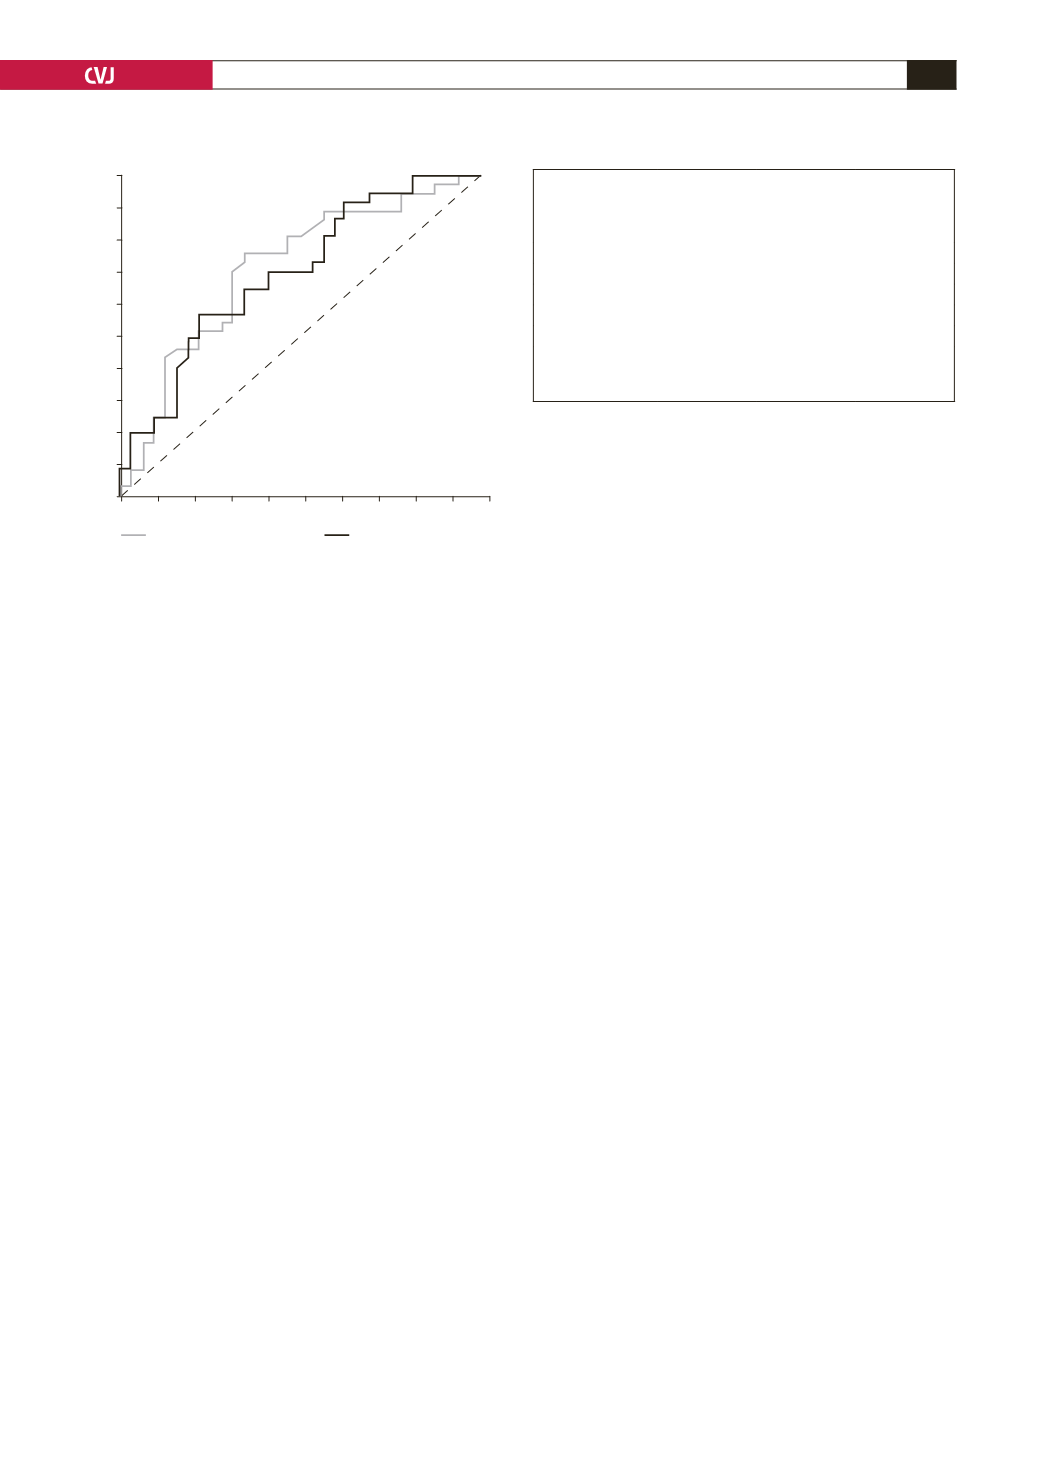
accurate diagnosis. As our study shows, when using the same
cut-off points that Kucher
et al
.
presented, D-dimer > 7
µ
g/
ml was 24% sensitive and 91.9% specific, and DDFR > 10
-3
was 35.1% sensitive and 84.5% specific. Based on our study,
D-dimer > 2.43
µ
g/ml and DDFR > 0.233
×
10
-3
had the best
accuracy (70 and 67.1%, respectively). However neither was
accurate enough to be used alone for the diagnosis of PTE in
the ICU setting or in long-term hospitalised patients suspected
of having PTE.
Study limitations
Up to the end of the first phase of our study, 91 patients were
enrolled and after filtering by the exclusion criteria, 81 patients
were included. Due to the use of antithrombotic agents and good
medical care, the incidence of PTE was low in the two hospitals
where we collected the samples. Therefore we could not divide
the patients into groups with different setting, such as medical
ICU and surgical ICU, in order to evaluate the influence of
different settings on D-dimer level and DDFR. We recommend
a study to compare fibrinogen and D-dimer levels and DDFR in
different settings and also in emergency departments as a unique
study to make the comparison more reliable.
Conclusion
No significant difference was found in the biochemical assays
between the hospitalised PTE and non-PTE patients. Moreover,
the significant difference in DDFR originated from D-dimer
and not fibrinogen levels. Therefore DDFR appears to be almost
as useful as D-dimer in diagnosing PTE in the ICU setting. In
addition, it was possible to rule out PTE with only the D-dimer
cut-off value of
<
0.43
µ
g/ml without using DDFR. However,
neither of these evaluations could replace angiography or CT
angiography.
References
1.
Janata K, Holzer M, Domanovits H,
et al.
Mortality of patients with
pulmonary embolism.
Wien Klin Wochenschr
2002;
114
(17–18):
766–772.
2.
Mühl D, Füredi R, Gecse K,
et al.
Time course of platelet aggregation
during thrombolytic treatment of massive pulmonary embolism.
Blood
Coagul Fibrinolysis
2007;
18
(7): 661–667.
3.
Bick RL. Disseminated intravascular coagulation: a review of etiology,
pathophysiology, diagnosis, and management: guidelines for care.
Clin
Appl Thromb Hemost
2002;
8
(1): 1–31.
4.
Wells PS, Anderson DR, Rodger M,
et al.
Excluding pulmonary embo-
lism at the bedside without diagnostic imaging: management of patients
with suspected pulmonary embolism presenting to the emergency
department by using a simple clinical model and d-dimer.
Ann Intern
Med
2001;
13
5(2): 98–107.
5.
Schluger N, Henschke C, King T,
et al
.
Diagnosis of pulmonary embo-
lism at a large teaching hospital. J Thorac Imaging. 1994; 9(3):180-4.
Goldhaber SZ. Pulmonary embolism.
N Engl J Med
1998;
339
(2):
93–104.
6.
Le Gal G, Righini M, Parent F, van Strijen M, Couturaud F. Diagnosis
and management of subsegmental pulmonary embolism.
J Thromb
Haemost
2006;
4
(4): 724–731.
7.
Perrier A. Noninvasive diagnosis of pulmonary embolism.
Hosp Pract
(
Minneap)
1998;
33
(9): 47–50, 53–55.
8.
Righini M, Nendaz M, Le Gal G, Bounameaux H, Perrier A. Influence
of age on the cost-effectiveness of diagnostic strategies for suspected
pulmonary embolism.
J Thromb Haemost
2007;
5
(9): 1869–1877.
9.
Kucher N, Kohler HP, Dornhöfer T, Wallmann D, Lämmle B. Accuracy
of D-dimer/fibrinogen ratio to predict pulmonary embolism: a prospec-
tive diagnostic study.
J Thromb Haemost
2003;
1
(4): 708–713.
10.
Boneu B, Bes G, Pelzer H, Sié P, Boccalon H. D-Dimers, thrombin
antithrombin III complexes and prothrombin fragments 1+2: diagnostic
value in clinically suspected deep vein thrombosis.
Thromb Haemost
1991;
65
(1): 28–31.
TABLE 4. RESULTS OF LOGISTIC REGRESSION
ANALYSIS OF SIGNIFICANTLY DIFFERENT
INDEPENDENTVARIABLESAT THE LEVEL OF < 0.1,
BOLD P-VALUE IS CONSIDERED SIGNIFICANT
p
Odds ratio
95%
CI
$
DDFR (
×
10
-3
)*
0.025
1.72
1.442–2.113
WBC (/mm
3
)
#
0.373
1.11
0.875–1.454
Temperature
0.001
145
0.542–3.91
E3
Gender
0.05
0.76
0.003–2.12
*
D-dimer:fibrinogen ratio.
#
White blood cell count.
$
95%
confidence interval calculated.
Fig. 1. ROC curve for D-dimer and DDFR to diagnose PTE
by different cut-off points; compare with Table 3.
1
0.9
0.8
0.7
0.6
0.5
0.4
0.3
0.2
0.1
0
0 0.1 0.2 0.3 0.4 0.5 0.6 0.7 0.8 0.9 1
D-dimer (
µ
g/ml)
DDFR (
×
10
–3
)


