CARDIOVASCULAR JOURNAL OF AFRICA • Vol 23, No 8, September 2012
AFRICA
439
diabetic patients, (2) that concentric remodelling was the most
prevalent abnormal LV geometric pattern in this population and
associated with reduced LV myocardial contractility and delayed
diastolic relaxation, and (3) that a simple algorithm combining
everyday clinical and laboratory assessment may be used to
identify diabetic patients with high risk of cardiac target-organ
damage.
Our findings add to a previous report by Ojji
et al.
on Nigerians
with type 2 diabetes.
21
In their study of 122 patients, abnormal
LV geometry was found in 51% of patients, compared to 74% in
the present study. Of note, the study by Ojji
et al
.
21
only included
normotensive type 2 diabetes patients, and as demonstrated by
our findings, hypertension was a strong covariate of having both
LV hypertrophy and increased RWT, probably explaining the
higher prevalence of abnormal LV geometry in the present study.
As demonstrated, age and systolic blood pressure were the main
confounders explaining the difference in LV structure between
groups of patients with type 1 or type 2 diabetes.
Hypertension, in particular isolated systolic hypertension,
increases in prevalence with aging, mainly as a consequence of
arterial stiffening imposing increased load on the left ventricle.
Older age has been documented to be particularly associated with
increased RWT, and with LV hypertrophy when hypertension
coexists.
22-24
However, despite differences in socio-demographic
backgrounds, our results were comparable to those reported by
Eguchi
et al
.
from Japanese hypertensive patients with type 2
diabetes. In their study, including 161 patients, the prevalence
of concentric remodelling, eccentric hypertrophy and concentric
hypertrophy, respectively, were 29, 16 and 39%.
25
We found no previous echocardiographic study on LV
geometric patterns performed among type 1 diabetes patients
from sub-Saharan Africa, and our study is probably the first
to describe LV geometry in such patients. As demonstrated by
our results, abnormal LV geometry was found in 40% of type 1
diabetes patients. Specifically, 30% of type 1 diabetes patients
had concentric remodelling, and this was the most common
type of abnormal LV geometry in this group. All six type 1
diabetes patients (10%) with LV hypertrophy had eccentric LV
hypertrophy.
Interestingly, none of the type 1 diabetes patients had
concentric LV hypertrophy, the most common abnormal LV
geometric pattern found among type 2 diabetes patients in the
present study. This finding could probably be explained by the
low prevalence of hypertension among type 1 diabetes patients in
our study (18 vs 82%). Other investigators have reported a higher
TABLE 5. INDEPENDENT COVARIATES OF HIGHER RWT IN TOTAL POPULATIONAND IN TYPE 1AND TYPE 2 DIABETES PATIENTS
Total population
(
R
2
=
0.69*)
Type 1
(
R
2
=
0.73*)
Type 2
(
R
2
=
0.66*)
Covariate
ß
p-
value
ß
p-
value
ß
p value
Systolic blood pressure (mmHg)
0.301
<
0.001
0.442
<
0.001
0.233
0.001
Low eGFR (ml/min/1.73 m
2
)
0.131
0.007
0.009
0.909
0.150
0.024
Low stress-corrected MWS (%)
0.239
<
0.001
0.493
<
0.001
0.156
0.017
Isovolumic relaxation time (ms)
0.170
0.001
0.180
0.041
0.155
0.016
LV mass/height
2.7
0.187
0.001
0.091
0.284
0.189
0.008
Circumferential end-systolic stress (dyne/cm
2
)
–0.584
<
0.001
–0.682
<
0.001
–0.602
<
0.001
Male gender
0.083
0.065
–0.009
0.905
0.123
0.051
eGFR
=
estimated glomerular filtration rate, MWS
=
midwall shortening, *
p
<
0.001.
20
15
10
5
0
125
100
75
50
25
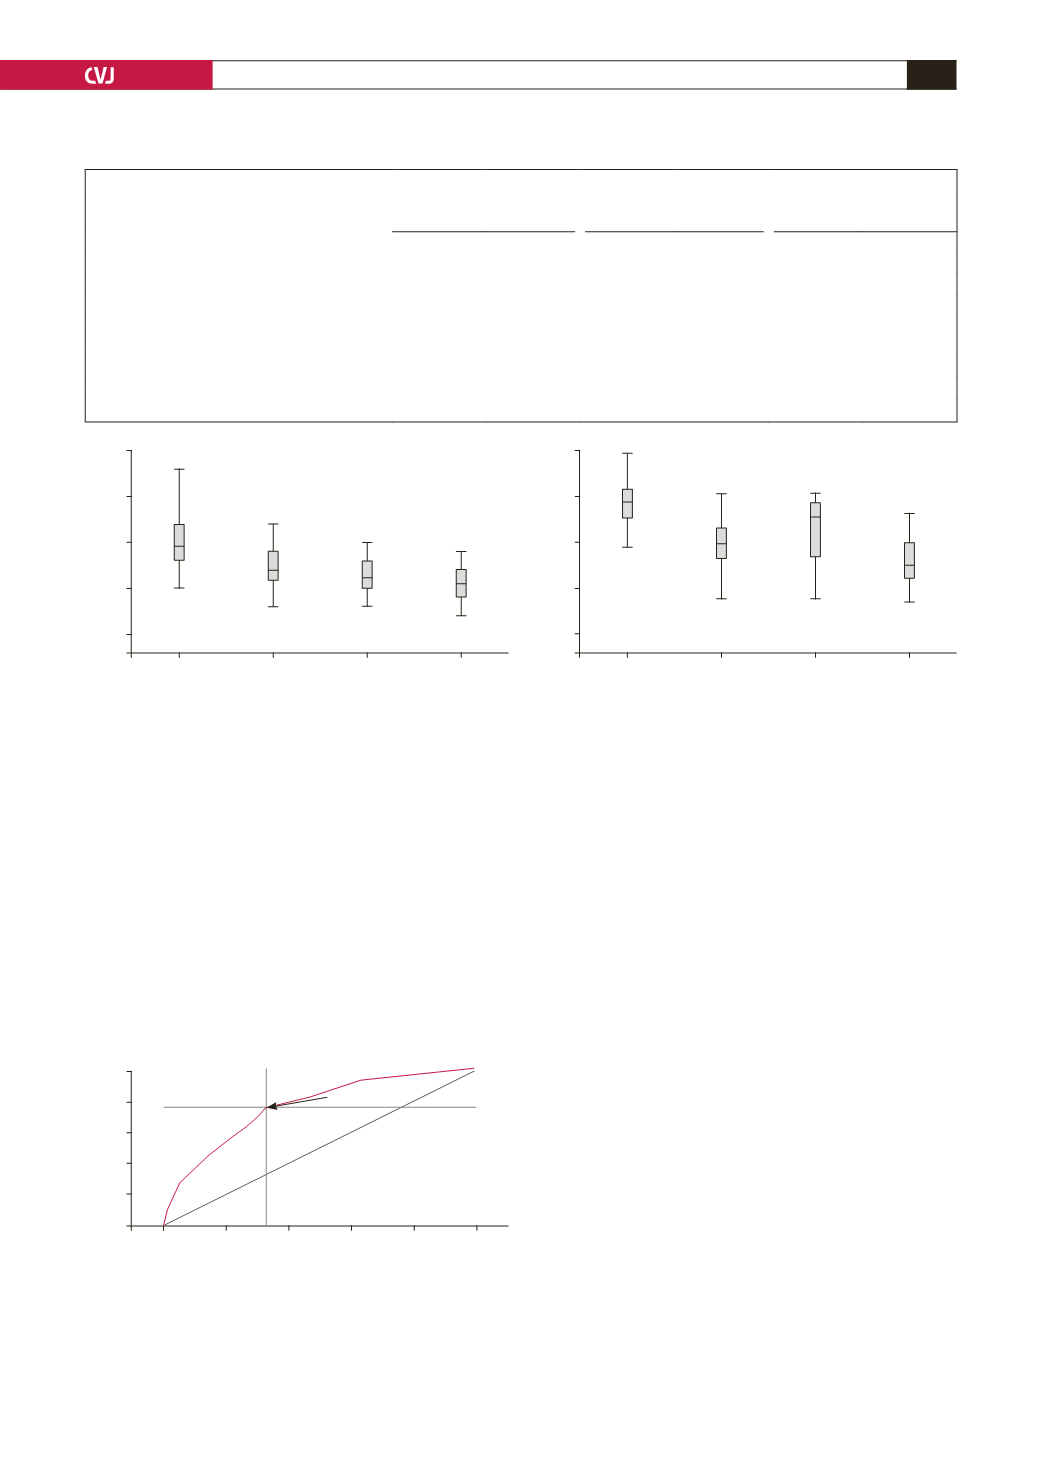
E
′
(
cm/sec)
scMWS (%)
Normal
Concentric
remodelling
Eccentric
LVH
Concentric
LVH
Normal
Concentric
remodelling
Eccentric
LVH
Concentric
LVH
Fig. 3. Early tissue Doppler velocity (E
′
)
and stress-corrected midwall shortening (scMWS) in relation to LV geometric
patterns;
p
<
0.001
for comparison of E
′
(
left panel) and scMWS (right panel) in the four geometric patterns by ANOVA.
Fig. 4. Receiver-operator characteristic (ROC) curve for
the clinical risk score with best sensitivity (76%) and
specificity (67%) in predicting high relative wall thick-
ness. The cut-off value for the risk score (13 points) iden-
tified by the ROC analysis is indicated by an arrow. AUC
=
area under the curve, PPV
=
positive predictive value.
1.0
0.8
0.6
0.4
0.2
0.0
Sensitivity
0.0
0.2
0.4
0.6
0.8
1.0
1 -
Specificity
ROC Curve
Risk score = 13 points
AUC = 0.77;
p
< 0.001
PPV = 76%


