CARDIOVASCULAR JOURNAL OF AFRICA • Vol 23, No 8, September 2012
438
AFRICA
=
0.77,
p
<
0.001,
sensitivity
=
76%
and specificity
=
67%).
This
risk score had a positive predictive value of 76% (Fig. 4).
Discussion
From echocardiographic studies in Caucasians, North American
Indians and African Americans, it is well known that diabetes is
associated with concentric LV remodelling, and LV hypertrophy
is particularly common in patients with combined type 2 diabetes
and hypertension.
19,20
However, few studies have reported on
LV geometry in diabetic populations from sub-Saharan Africa.
Therefore, the present study is among the few to report on
prevalence and covariates of abnormal LV geometry in diabetic
sub-Saharan African patients.
The study has many interesting findings, adding to current
knowledge on diabetic heart disease in Africans, in particular (1)
that abnormal LV geometry is common in sub-Saharan African
or 0 if it was absent. Therefore the individual risk score varied
in this study population between 0 and 35 points. Based on the
ROC curve analysis, the optimal cut-off point for the prediction
of increased RWT was a score of 13 points (area under the curve
50
40
30
20
10
210
180
150
120
90
BMI (kg/m
2
)
SBP (mmHg)
Normal
Concentric
remodelling
Eccentric
LVH
Concentric
LVH
Normal
Concentric
remodelling
Eccentric
LVH
Concentric
LVH
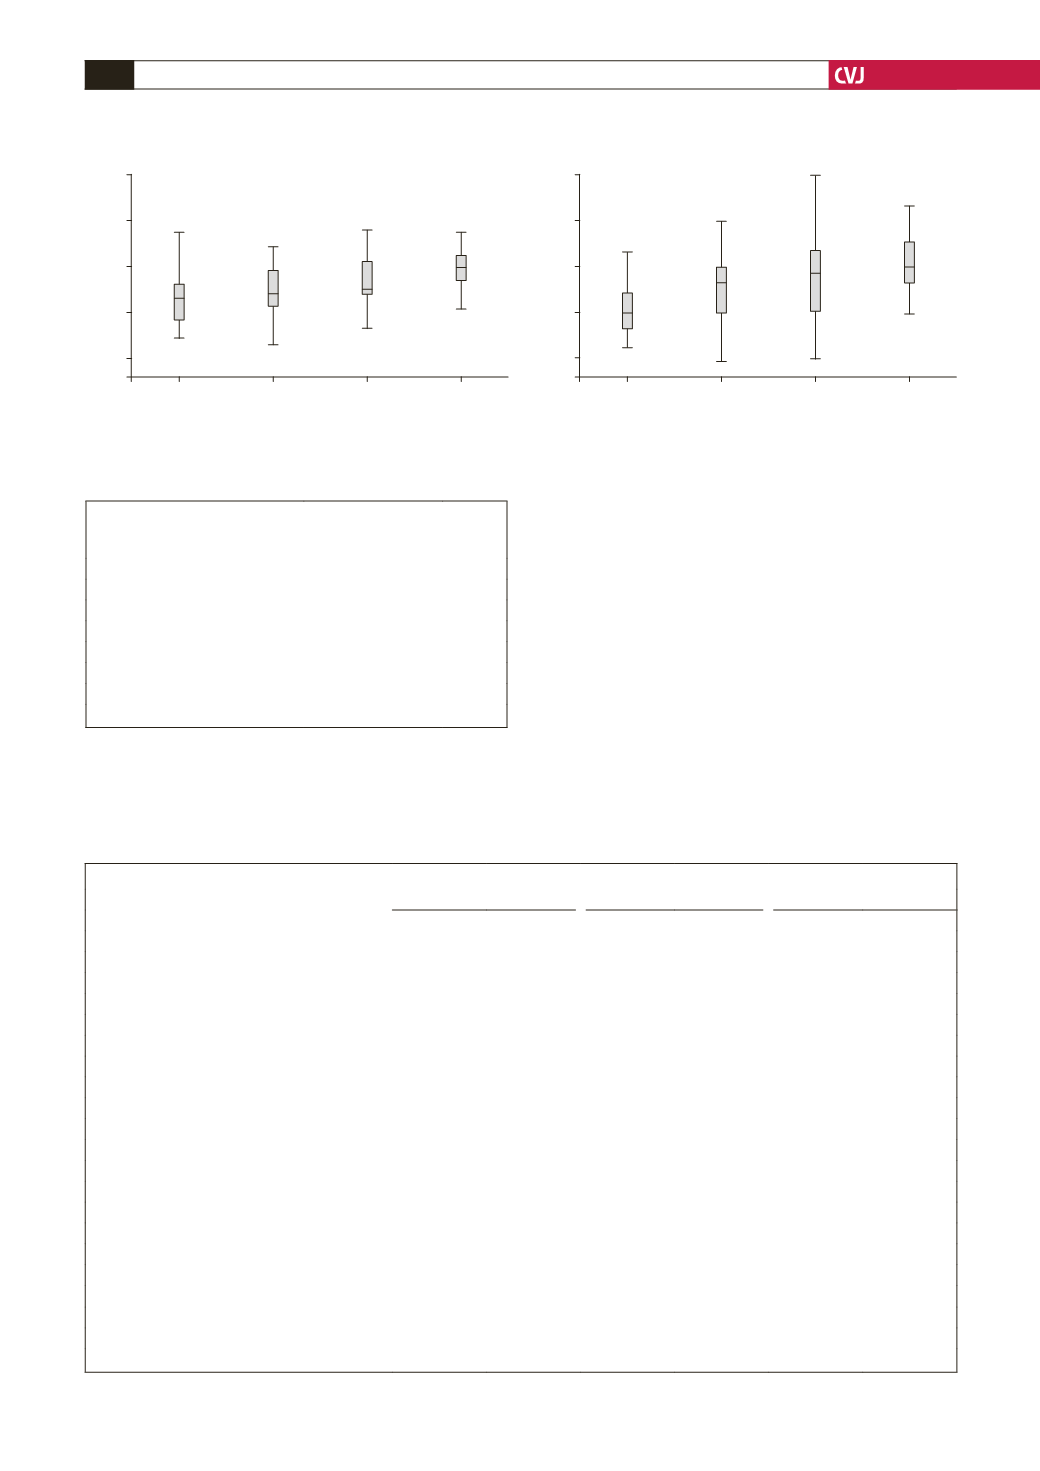
Fig. 2. LV geometry in relation to body mass index and systolic blood pressure, and impact on comparison between
the different LV geometric patterns;
p
<
0.001
for comparison of body mass index (left panel) and systolic blood pres-
sure (right panel) in the four geometric patterns by ANOVA.
TABLE 3. INDEPENDENT PREDICTORS OF
LV HYPERTROPHY IN THE TOTAL POPULATION
BY LOGISTIC REGRESSIONANALYSIS
Variable
Odds ratio (95% CI)
p-value
Obesity
3.97 (1.65–9.54)
0.002
Hypertension
4.58 (1.32–15.85)
0.016
Albuminuria
2.31 (1.01–5.27)
0.047
Age (years)
1.03 (0.98–1.08)
0.206
Male gender
0.66 (0.28–1.53)
0.329
Type of diabetes (type 1 vs type 2)
0.73 (0.13–4.17)
0.727
Duration of diabetes (years)
0.99 (0.92–1.06)
0.785
TABLE 4. CORRELATES OF RWT IN THE TOTAL POPULATIONAND IN TYPE 1 AND TYPE 2 DIABETES PATIENTS
Total population
Type 1
Type 2
r
p
-
value
r
p
-
value
r
p
-
value
Age (years)
0.391
<
0.001
0.357
0.005
0.203
0.035
Body mass index (kg/m
2
)
0.237
0.002
0.068
0.605
0.031
0.752
Systolic blood pressure (mmHg)
0.383
<
0.001
0.359
0.004
0.234
0.015
Diastolic blood pressure (mmHg)
0.388
<
0.001
0.331
0.009
0.282
0.003
Fasting blood glucose (mmol/l)
0.029
0.705
0.204
0.118
0.068
0.485
HbA
1
c
(%)
–0.009
0.909
0.113
0.390
0.066
0.496
eGFR (ml/min/1.73 m
2
)
–0.282
<
0.001
–0.076
0.563
–0.319
0.001
HDL cholesterol (mmol/l)
–0.165
0.033
–0.146
0.265
–0.277
0.002
Triglycerides (mmol/l)
0.134
0.082
0.279
0.031
0.079
0.416
Triglyceride-to-HDL cholesterol ratio
0.108
0.163
0.141
0.287
0.175
0.069
Log UACR (mg/g)
0.147
0.059
0.259
0.048
0.194
0.045
E
′
(
cm/sec)
–0.434
<
0.001
–0.149
0.246
–0.377
<
0.001
LV mass/height
2.7
(
g/m
2.7
)
0.477
<
0.001
0.113
0.389
0.426
<
0.001
E/A ratio
–0.382
<
0.001
–0.321
0.012
–0.241
0.012
Deceleration time (ms)
0.313
<
0.001
0.255
0.047
0.228
0.017
Isovolumic relaxation time (ms)
0.428
<
0.001
0.304
0.017
0.347
<
0.001
Circumferential end-systolic stress (dyne/cm
2
)
–0.421
<
0.001
–0.349
0.006
–0.557
<
0.001
Midwall shortening (%)
–0.717
<
0.001
–0.619
<
0.001
–0.723
<
0.001
Stress-corrected midwall shortening (%)
–0.755
<
0.001
–0.675
<
0.001
–0.759
<
0.001
E/E
′
0.299
<
0.001
–0.158
0.228
0.293
0.002
HbA
1
c
=
glycated haemoglobin, eGFR
=
estimated glomerular filtration rate, HDL
=
high-density lipoprotein, UACR
=
urine albumin creatinine ratio.


