CARDIOVASCULAR JOURNAL OF AFRICA • Vol 24, No 3, April 2013
56
AFRICA
urban settings.
10-12
The prevalence of raised blood glucose levels
(defined as capillary whole BG of at least 6.1 mmol/l) in 31% of
females and 10% of males, DM (13.9% had a family history of
DM, 2.9% were diabetic), raised BMI (15.6% were overweight,
6.7% were obese), and tobacco smoking (24% had history
of smoking with 9.6% heavy smokers) were markedly higher
than previously speculated. The level of physical activity was
surprisingly lower than expected in this predominantly hilly area,
although different definitions of physical activity could have led
to this response. These findings support the need for regular
screening of individuals for NCDs and their risk factors.
There was a high prevalence of underweight people (29.9%).
When taken together with the observed rates of DM and glucose
intolerance, questions arise with regard to the possibility of a
connection between under-nutrition and DM.
In general, this study highlights the need to undertake
population-based studies in all districts in the country to quantify
the magnitude of NCDs at a national level. It is evident that
there is variation among ethnic groups and locations, as various
factors contribute to the development of disease and other factors
contribute to the perpetuation of diseases.
In order to institute a cost-effective intervention, the specific
factors at play in a given population must be identified. It
may not be appropriate to generalise these findings to refer to
the Karamoja population. These results though are useful in
guiding intervention and preventative measures for the Kasese
population, and should be well received by policy makers in the
local government of Kasese, as well as the ministry headquarters.
For example, vegetables and fruits are grown in large quantities
in Kasese, but consumption is low. Most are sold to the cities.
The population is not aware of the benefits to their health
of eating fruit and vegetables. Mass education to encourage
increased consumption of fruits and vegetables will benefit the
population.
A key strength of this study was the use of a representative
sample, with analysis taking into account the complex survey
design. The relatively high response level minimises the
likelihood of selection bias, and the range of factors that were
measured should be a good reflection of those factors in the
Kasese population. The use of WHO standardised protocols,
intensive training of data-collection staff, pre-study testing
of procedures, and the close supervision of staff during data
collection all highlight the attention that was paid to minimising
avoidable sources of measurement error.
Limitations of this study need to be borne in mind. The STEPS
methodology is designed to provide standardised information on
key modifiable risk factors that can be measured in population-
based surveys without resorting to high-technology instruments.
It is not designed to measure total energy intake, dietary fat,
dietary sodium, body fatness or physical activity by objective
methods, such as accelerometry and pedometry. Information
on these factors would have provided a more comprehensive
picture of the relationships we studied. In addition, these cross-
sectional data do not allow age-related differences in BP, blood
glucose and total cholesterol levels to be attributed to ageing,
independent of cohort effects. Assessment of risk factors by age
group as well as fasting blood sugar level for different BMIs
would have provided more insight. Finally, due to lack of power,
we were not able to assess the relationship between underweight
and diabetes.
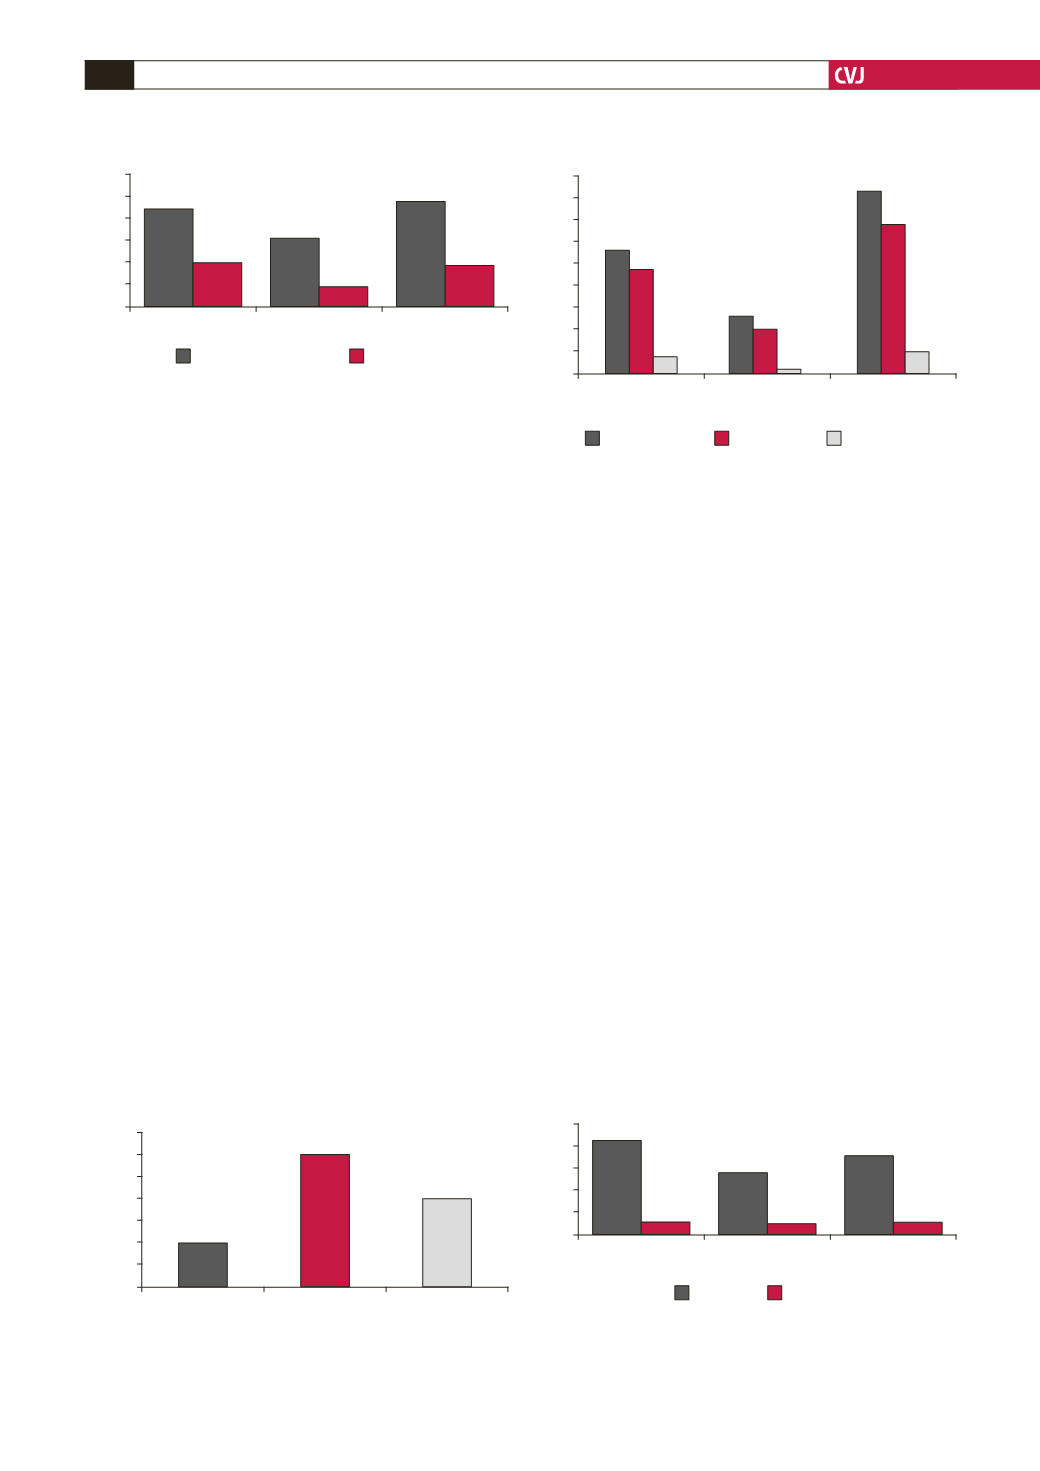
Fig. 8. Smoking habits; 24% had a history of smoking;
9.6% were daily smokers (average number of cigarettes
per day was six for males and three for females).
30
25
20
15
10
5
0
Male
Female
M + F
% of total population
Smoking habits
Tobacco smoking
Daily smokers
Fig. 9. Physical activity; 51% of the population were
physically inactive.
50.5
50
49.5
49
48.5
48
47.5
47
Male
Female
M + F
% of total population
Physical activity
Fig. 10. Alcohol consumption; 41.6% had never drunk
alcohol in their life; 34.1% had drunk in the past 12
months; 5.3% of the active drinkers drank
≥
five days/
week (average number of drinks per day was three for
men and two for women).
45
40
35
30
25
20
15
10
5
0
Male
Female
M + F
% of Population
Ever Drunk
≥
5 days per wk
Last 1 yr
Alcohol drinking habits
Fig. 11. Fruit and vegetable intake; 7.2% of the total
population ate five or more servings of fruit per week;
1.2% of the total population ate five or more servings of
vegetables per week.
10
8
6
4
2
0
Male
Female
M + F
% of total population
Fruit and vegetables consumption
Fruits
Vegetables


