CARDIOVASCULAR JOURNAL OF AFRICA • Vol 24, No 3, April 2013
54
AFRICA
Results
A total of 611 eligible adults were selected and approached to
participate in the survey. Of these, 93 (15.22%) refused while
518 (84.87%) consented to take part in the survey. Of the 518
participants who took part, 56% were female and 29% had no
formal education, while 41% had primary school education.
BP, and fasting blood sugar and total cholesterol levels were
measured in 100, 25.7 and 27.8%, respectively of the 518
participants (Fig. 1, Table 1).
Sixteen per cent of females and 11% of males were told by
the doctor that they had hypertension, while only 8% of females
and 7% of males with diagnosed hypertension were currently on
medication for hypertension (Fig. 2). Twenty per cent of females
had SBP
≥
140 mmHg and 20% had DBP
≥
90 mmHg; while
22% of males had SBP
≥
140 mmHg and 17% had DBP
≥
90
mmHg (Fig. 3). There was no statistical difference between the
genders (SBP,
p
=
0.758; DBP,
p
=
0.503).
Ten per cent of males had fasting blood sugar levels
>
6.0
mmol/l compared to 33% of females, while 12.5% of male had
a positive family history of diabetes mellitus (DM) and 3.5%
were on treatment for DM. Sixteen per cent of females had a
positive family history of DM and 2.2% were on treatment for
DM (Figs 4, 5).
TABLE 1. CHARACTERISTICS OF THE STUDY PARTICIPANTS
Total
Male
Female
n
%
n
%
Gender*
528 297 45.5 231
54.5
Age (years)
25–34
179
98 34.0 81 35.1
35–44
118
63 21.9 55 23.9
45–54
104
57 19.9 47 20.2
55–64
57
36 12.8 21 9.3
>
64
60
33 11.5 27 11.5
Education
None
112
41 14.1 71 30.9
Primary school
243 129 45.1 114 49.7
Secondary school (O level)
113
82 28.3 31 13.5
Secondary school (A level)
27
18 6.4
9 3.9
University/college
23
17 6.1
6 2.0
Occupation
Peasant
326 159 55.6 167 72.2
Trader
20
11 3.7
9 3.9
Teacher
28
22 7.4
6 2.5
Housewife/homemaker
10
0 0
10 4.49
Other
80
66 23.3 14 6.2
None
54
29 10.1
25 10.7
Marital status
Married
411 244 84.9 167 71.9
Separated
38
17 6.1 21 9.3
Widowed
39
8 2.4 31 13.5
Never married
30
18 6.7 12 5.3
*Percentage is by column for gender only. The rest of the variables are by
rows.
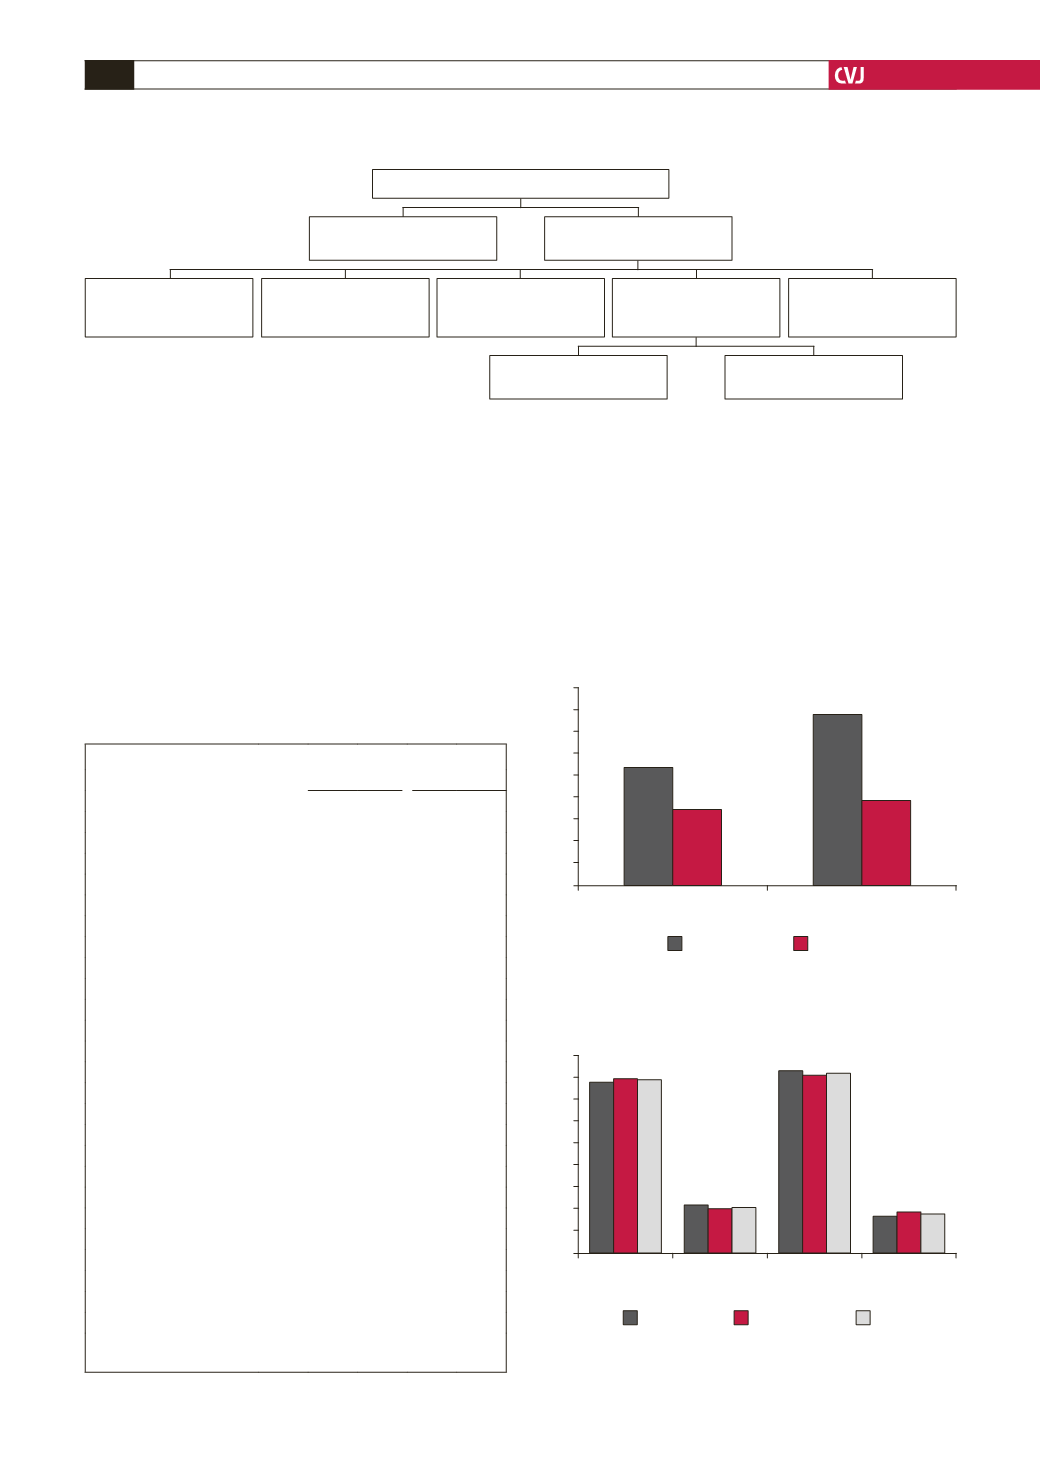
Fig. 1. Flow diagram.
Number of eligible participants selected 611
No. refused to take part in
the survey (93, 15.22%)
Fasting blood glucose
(128, 25.65%)
Number of participants
interviewed (518, 100%)
Number of participants
with body mass index
measured (513, 99.03%)
Number of participants
with blood pressure
measured (518, 100%)
Number of participants
with blood glucose
measured (499, 96.33%)
Number of participants
with blood cholesterol
measured (518, 100%)
No. consented to take part
in the survery (518, 84.78%)
Non-fasting blood glucose
(371, 74.35%)
Fig. 2. History of hypertension (HT) and treatment status;
11% of males knew of their hypertension, 7% were on
treatment; 16% of females knew of their hypertension, 8%
were on treatment.
18
16
14
12
10
8
6
4
2
0
Male
F
%
History of hypertension
Told by Dr.
on Treat
Fig. 3. Systolic and diastolic BP; 21% of the population
had SBP
≥
140 mmHg; 18% had DBP
≥
90 mmHg.
90
80
70
60
50
40
30
20
10
0
<
140
≥
140
<
90
≥
90
%
Systolic BP
Diastolic BP
Blood pressure
Male
M + F
Female


