


 9 / 64

CARDIOVASCULAR JOURNAL OF AFRICA • Volume 27, No 1, January/February 2016
AFRICA
7
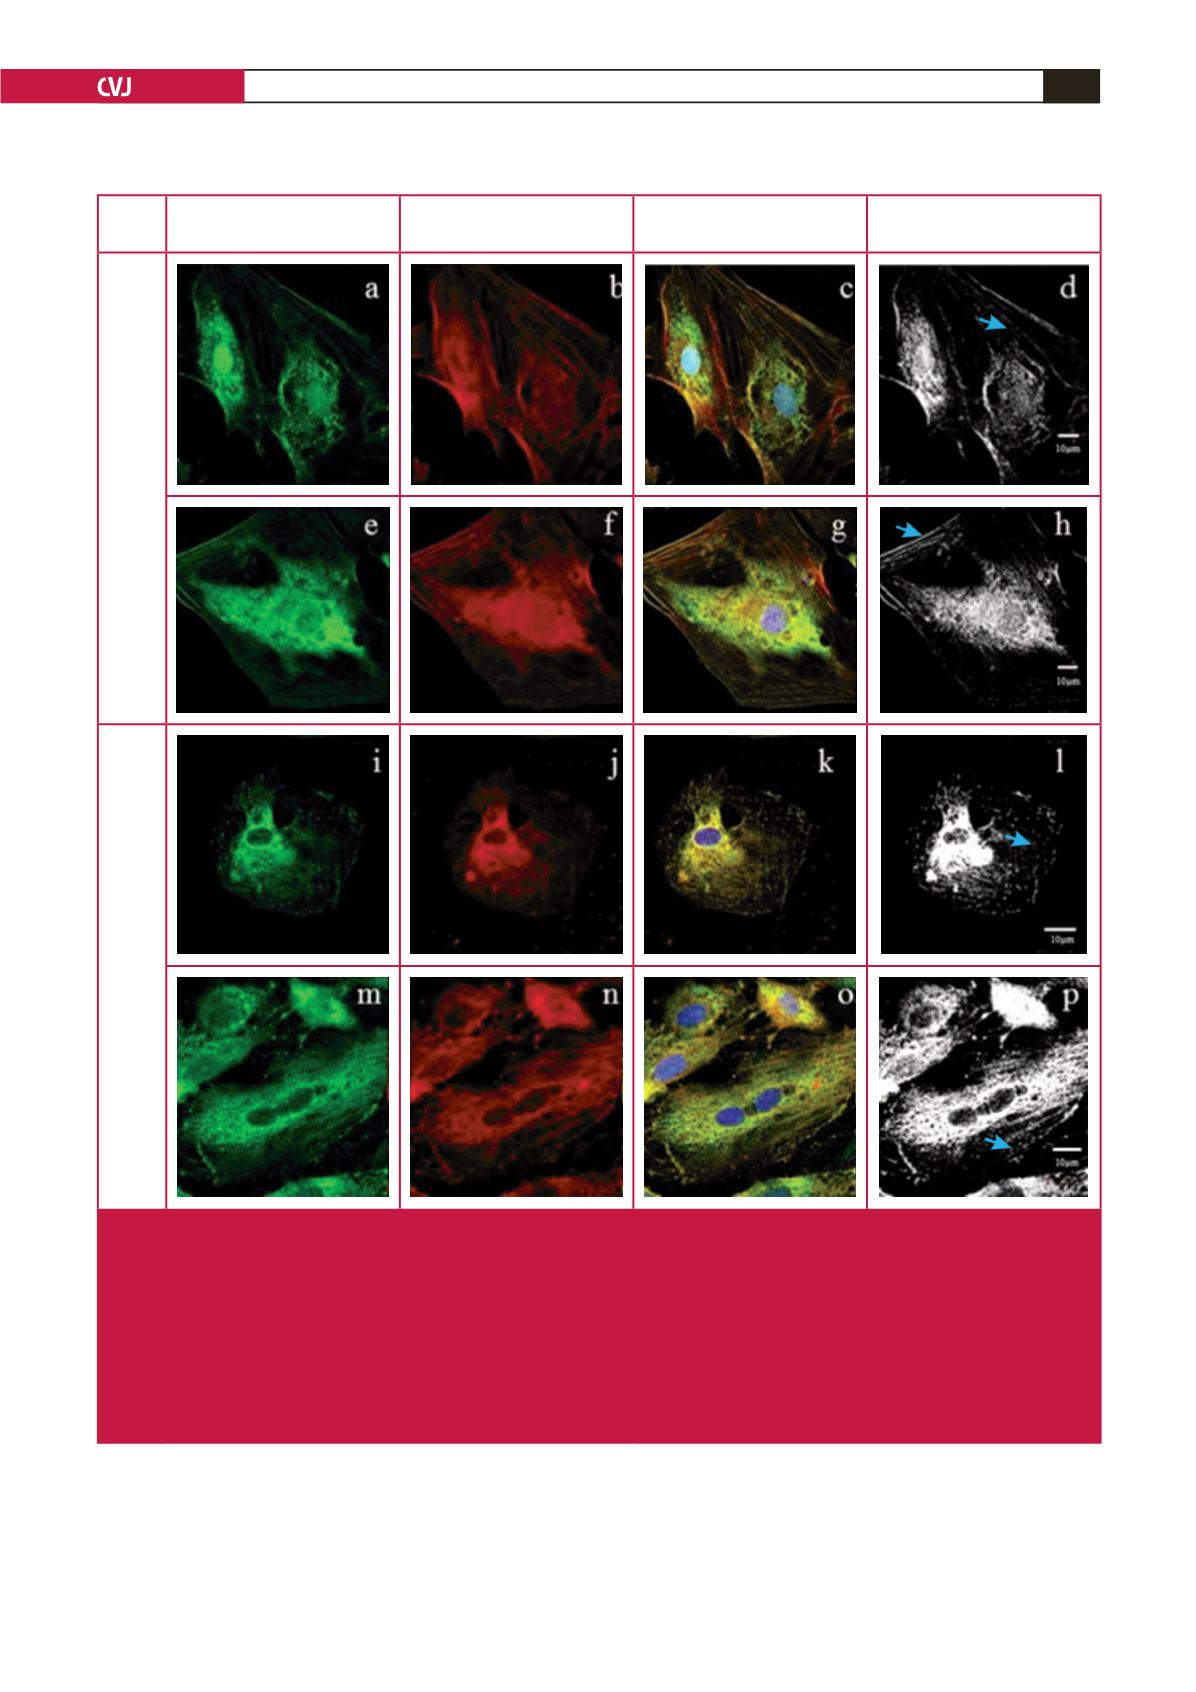
of these proteins was observed. Following hypoxic stress, the
internal cellular structure became disrupted and the filaments
and cytoskeleton showed clear signs of disarray (Fig. 1i–p). The
less well-defined signal appearance of co-localisation seen in Fig.
1l and p may be attributable to this disarray.
While co-localisation analysis provided convincing evidence
that KNCE2 and FLNC are located in close proximity to one
another within the cell, this does not necessarily mean that they
physically interact. For this reason, Co-IP analysis was used to
determine whether a physical interaction exists between the two.
KCNE2
FLNC
Overlay
Co-loc
Normoxic
Hypoxic
Fig. 1.
Fluorescent imaging and co-localisation analysis of KCNE2 and FLNC in differentiated H9C2 cardiomyocytes under normoxic
and hypoxic conditions. (a–h) Co-localisation under normoxic conditions. (i–p) Co-localisation under hypoxic conditions. (a, e,
i, m) KCNE2 labelled with the rabbit polyclonal anti-KCNE2 primary antibody and a donkey anti-rabbit Alexa 488 secondary
antibody (green). (b, f, j, n) FLNC labelled with the goat polyclonal anti-Filamin C primary antibody and donkey anti-goat Cy3
secondary antibody (red). (c, g, k, o) Overlay images of a–b, e–f, i–j and m–n, respectively with Hoechst H-33342 nuclear
staining (blue). (d, h, l, p) Co-localisation of KCNE2 and FLNC generated from merged images (white). Arrows in d and h
indicate the ordered filamentous structure in the cardiomyocytes under normoxic conditions (blue). Arrows in l and p indi-
cate the disordered filamentous structure in the cardiomyocytes under hypoxic conditions (blue). Micrographs are shown as
maximum-intensity projections based on z-stack image frames. Co-loc: co-localisation; FLNC: filamin C; KCNE2: potassium
voltage-gated ion-channel subfamily E member 2. Scale bar 10 µm.