


 12 / 68

CARDIOVASCULAR JOURNAL OF AFRICA • Volume 30, No 3, May/June 2019
140
AFRICA
be concluded that over the 25-year period of follow up, the
development of aerobic fitness between 13 and 36 years of
age was independently and positively related to daily physical
activity in both genders (
p
<
0.001). This relationship was
significant in the crude univariate model (corrected for gender
and initial VO
2 peak
value) as well as in the two models adjusted
for lifestyle and biological parameters (Table 3).
However, the functional implications of the statistically highly
significant relationships seem to be small: a 10% difference in
MET-score was positively related to a 0.3% difference in VO
2 peak
.
By contrast, the results of the auto-regression model, which
was controlled for present VO
2 peak
, revealed no significant
relationship between physical activity and aerobic fitness in both
genders over the period of follow up (13- to 36-year age period).
A difference in physical activity of 10% appeared to be positively
related to a non-significant difference in VO
2 peak
of only 0.04%
(95% CI: –0.06 to 0.13).
The BMD of hip, lumbar spine and wrist was measured three
times by dual X-ray absorptiometry (DEXA) between 27 and
36 years of age. Lumbar and hip BMD was significantly and
positively related to physical activity but not to dietary calcium
intake during the teenage period.
Type of daily physical activity is also important for bone mass.
From animal experiments, it is known that dynamic mechanical
loading of short duration seems more effective than metabolic
loading.
9
In the lumbar spine and femoral neck during youth,
the explained variance was 15 and 11% with mechanical physical
activity (MECHPA) and only 4 and 2% with metabolic physical
activity (METPA). No difference could be observed on the distal
radius.
10
This last result validates the importance of mechanical
loading, because in general, the daily load on the upper extremities
is far less than on the lower extremities in humans.
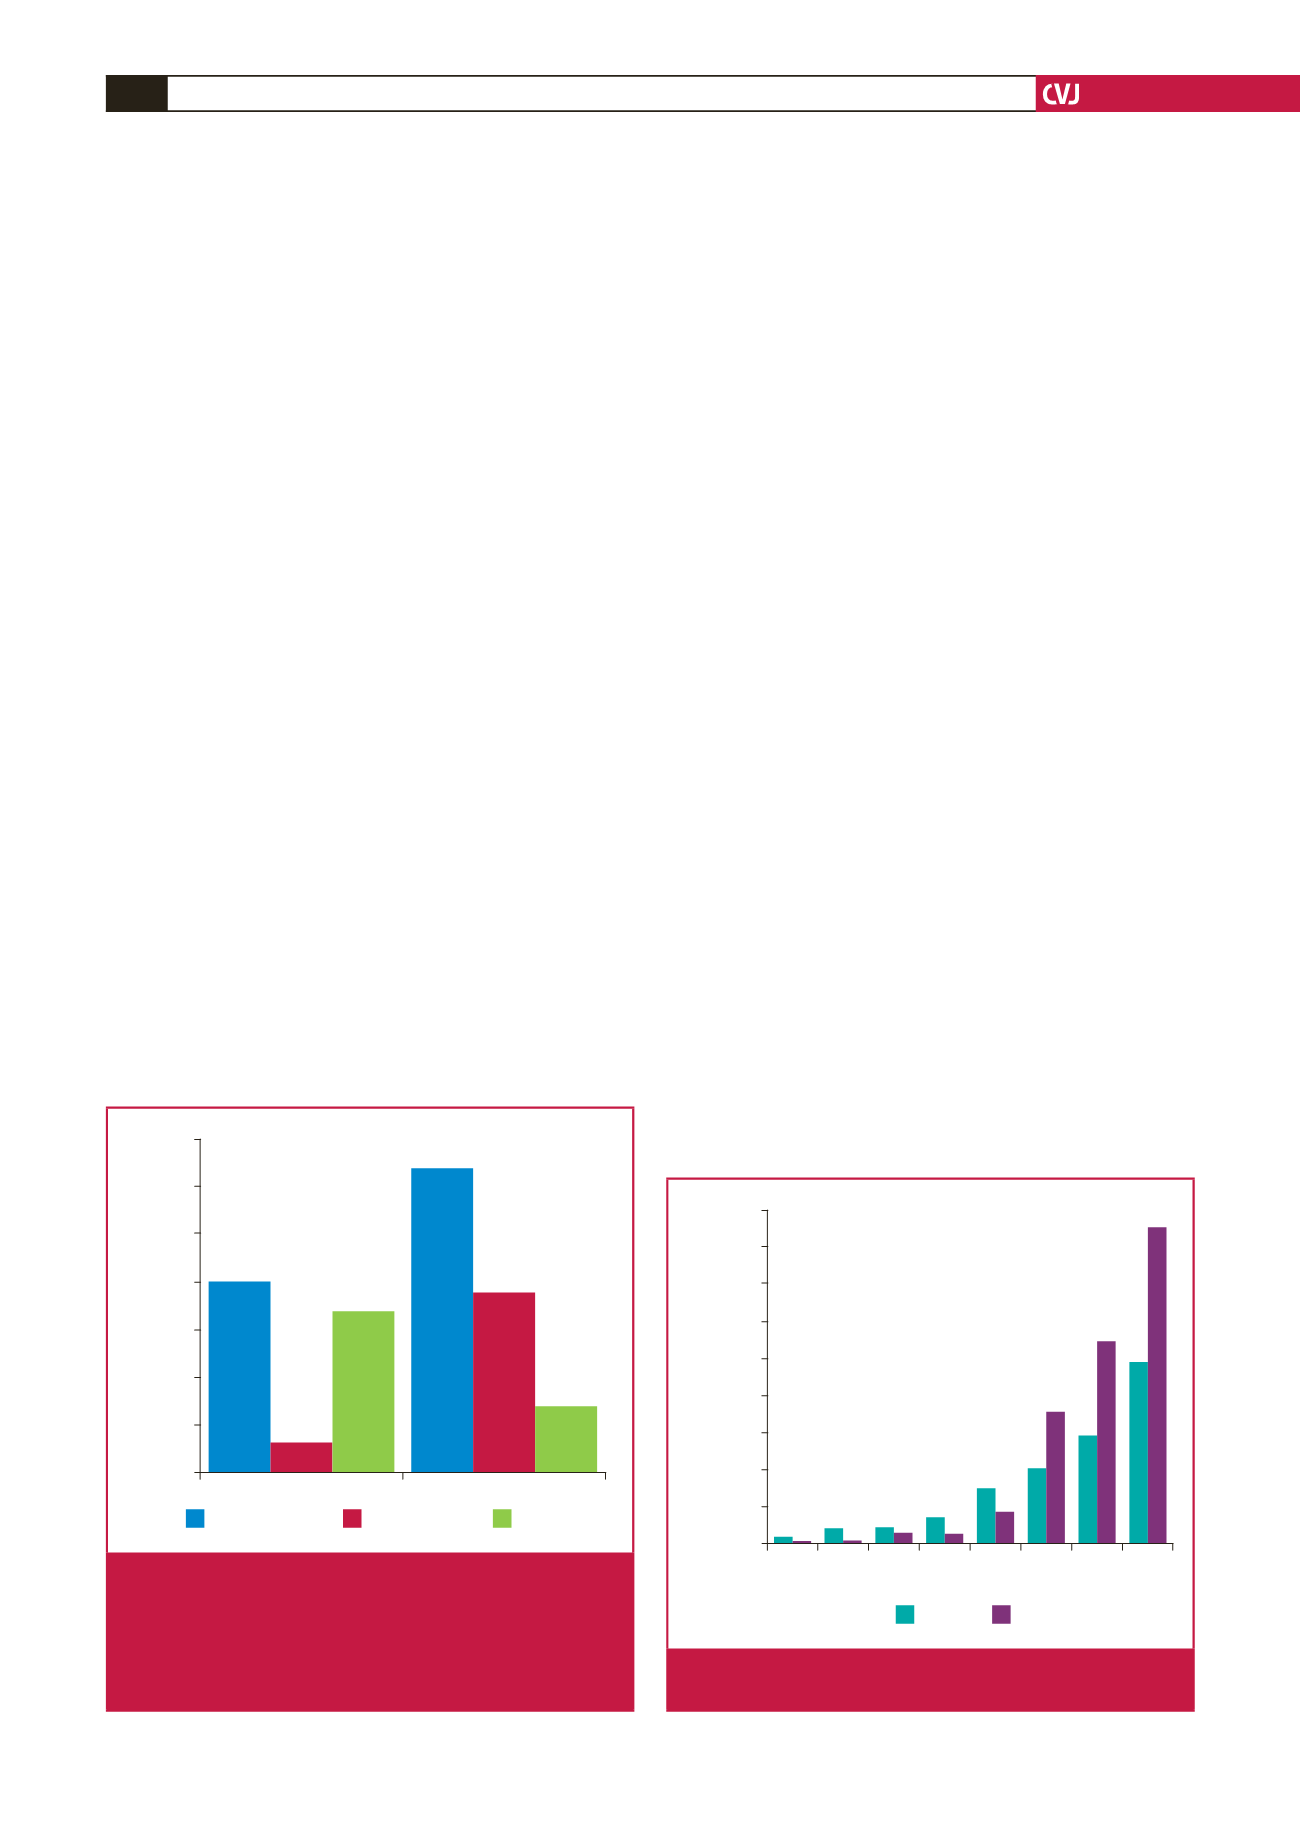
Fig. 1 shows the standardised regression coefficients (corrected
for gender, body height and weight, fat mass, biological age
and calcium intake) of the lumbar BMD at age 32 years with
the physical activity pattern during three periods: adolescence
(13–16 years), young adulthood (21–27 years) and the total
period (13–27 years). The highest coefficients (beta) were with
MECHPA over the total period of 15 years (beta
=
0.33;
p
<
0.01). During young adulthood (the seven-year period of age
21–28 years), MECHPA was also significantly related to lumbar
BMD at age 32 years (beta
=
0.20;
p
=
0.01). Only METPA
results during adolescence and during the total period were
significantly (
p
<
0.01) related to lumbar BMD at age 32 years,
with beta values of 0.18 and 0.21 respectively.
5
We investigated the longitudinal relationship between daily
physical activity and daily food intake on one hand, with the
development of overweight and obesity over the 23-year follow-
up period on the other hand. Fig. 2 shows that the percentage
of males and females with a BMI above 25 kg/m
2
increased
exponentially with age: at 36 years, 43% of the males and 25%
of the females were overweight or obese, while less than 5% were
overweight in adolescence.
The longitudinal relationship of the actual values of daily
physical activity with BMI resulted in significant (
p
=
0.02)
negative regression coefficients in males but not in females. As
expected, more daily physical activity resulted in less fat mass
with daily food intake, however, the regression coefficients with
S4S were significant in both males and females, and with BMI
only in females, but these were not in the expected direction
(lower daily food intake resulted in more fat mass) (Table 4).
More daily physical activity resulted in significantly lower fat
mass and less overweight and obesity. Surprisingly, higher S4S
and BMI were related to lower daily food intake. This unexpected
result that a lower energy intake over 23 years was related to
higher fat mass can be explained in two ways: (1) under-reporting
of daily food intake by the more overweight subjects, and (2)
repeated measurements could introduce negative testing effects.
Therefore, the origin of overweight and obesity in this
longitudinal study cannot merely be explained by an increase in
energy intake, but rather by a decrease in energy expenditure.
12
METPA
MECHPA
beta
0.35
0.30
0.25
0.20
0.15
0.10
0.05
0
15 years (13–27)
7 years (21–27)
4 years (13–16)
* =
p
< .01
*
*
*
*
Fig. 1.
Standardised regression coefficients of lumbar BMD at
age 32 years, and lumbar BMD at age 32 years with
mechanical physical activity (MECHPA) and meta-
bolic physical activity (METPA) over three age periods:
adolescence (13–16 years); young adulthood (21–27
years), and the total period (13–27 years).
13 14 15 16 21 27 32 36
Age (years)
%
45
40
35
30
25
20
15
10
5
0
Women
Men
Fig. 2.
The percentage of males and females with a BMI
above 25 kg/m
2
from age 13 to 36 years.