


 6 / 68

CARDIOVASCULAR JOURNAL OF AFRICA • Volume 30, No 3, May/June 2019
134
AFRICA
and characteristics of CR services around the globe, through
a first-ever international survey.
14,15
Detailed methods have
been reported elsewhere.
14-16
In brief, the existence of CR in
each country of the world was ascertained through clinical
associations. CR programmes were defined as those that offered:
(1) initial assessment, (2) structured exercise, and (3) at least
one other strategy to control CV risk factors. Countries were
classified according to World Health Organisation (WHO)
regions (47 in Africa).
Where available, champions from each country with CR
were enlisted to identify the number of programmes, and also
to administer an online survey of these programmes, which
assessed both patient capacity and programme characteristics.
No champions were available outside of South Africa, but
the African Heart Network and World Heart Federation were
consulted to identify programmes continent-wide.
CR density (number of CR spots per incident IHD case
annually) was computed using Global Burden of Disease study
estimates for annual IHD prevalence,
1
to characterise the number
of CR spots available per patient in need per year. Global
results,
14,15
and results in LMICs specifically,
17
have been reported
elsewhere. In this report, we first provide an overview of the
availability of CR in Africa, specifically. Then we summarise CR
service provision, and finally we provide suggestions to overcome
gaps identified.
CR in Africa
A total of 32 CR programmes were identified across 8/47
(17%) African countries (the lowest proportion of all WHO
regions, with the next lowest being the western Pacific at 43%).
The majority (
n
= 23, 72%) of programmes were in South
Africa, with the first African programme opening in 1989.
14,15
Overall, data were collected in four of the eight countries,
with 18/32 programmes in those eight countries responding
(56.3% programme response rate, although only 17 surveys were
sufficiently completed for reporting).
Table 1 summarises key findings in terms of national
availability and capacity for the African continent, CR density
and unmet need.
14,17
For those African countries in which CR
programmes were identified, the CR density relative to the 86
countries to which they could be compared in the CR survey
globally was poor [median African country ranking = 76 (Q25–
Q75 = 66–86)].
14
The mismatch between CR availability and need
was greatest in Nigeria, with one spot per 4 480 IHD patients.
17
Raw unmet need (considering zero availability in countries
without CR) for Africa was 1 383 858 – this many more spots are
needed per year to treat IHD patients alone.
17
This does not take
into consideration spots for heart failure patients who are also
indicated,
18
or other NCD patients such as those with stroke,
19
peripheral vascular disease and diabetes,
20
whom are also shown
Table 1. CR availability and capacity in Africa
Country
Lending
group
25
Human develop-
ment index* IHD incidence
†
CR
programmes
in country (
n
responded)
#
Median annu-
al volume/
programme
Median annu-
al capacity/
programme
National CR
capacity
‡
CR density
§
Unmet need
Algeria
UMI
0.745
140 592
1 (0)
NA
NA
NA
NA
Inestimable
Mauritius
UMI
0.513
3 872
1 (1)
60
60
60
65
3 812
South Africa UMI
0.666
108 455
23 (14)
50
90
2 070
52
106 385
Kenya
LMI
0.555
55 174
3 (1)
20
50
150
368
55 024
Nigeria
LMI
0.527
223 994
1 (1)
50
50
50
4 480
219 514
Benin
LIC
0.485
11 973
1 (0)
NA
NA
NA
NA
Inestimable
Tanzania
LIC
0.531
64 326
1 (0)
NA
NA
NA
NA
Inestimable
Uganda
LIC
0.493
31 951
1 (0)
NA
NA
NA
NA
Inestimable
Mean ± SD
0.564 ± 0.092 80 042 ± 74 459
4 ± 8
45 ± 15
63 ± 16
583 ± 860 1 241 ± 1 874 96 184 ± 92 270
Median (Q25–Q75)
0.529
(0.498–0.638)
59 750
(16 968–132 558)
1
(1–3)
50
(28–58)
55
(50–83)
105
(53–1 590)
216
(55–3 452)
80 705 ±
(11 615–191 232)
*Human development index was obtained from United Nations Development Programme.
26
†
Incidence of IHD was obtained from Global Burden of Disease study.
1
‡
National CR capacity was calculated using the median number of patients the programme could serve per year (from survey) multiplied by the number of programmes
in the country (ascertained from national champions); value represents the number of patients who could receive CR in a year (CR spots).
§
CR density refers to the number of incident IHD cases per year per CR spot (national CR capacity).
LIC, low-income country; LMI, lower-middle income; UMI, upper-middle income; IHD, ischaemic heart diseases; CR, cardiac rehabilitation; NA, not available; SD,
standard deviation; Q, quartile.
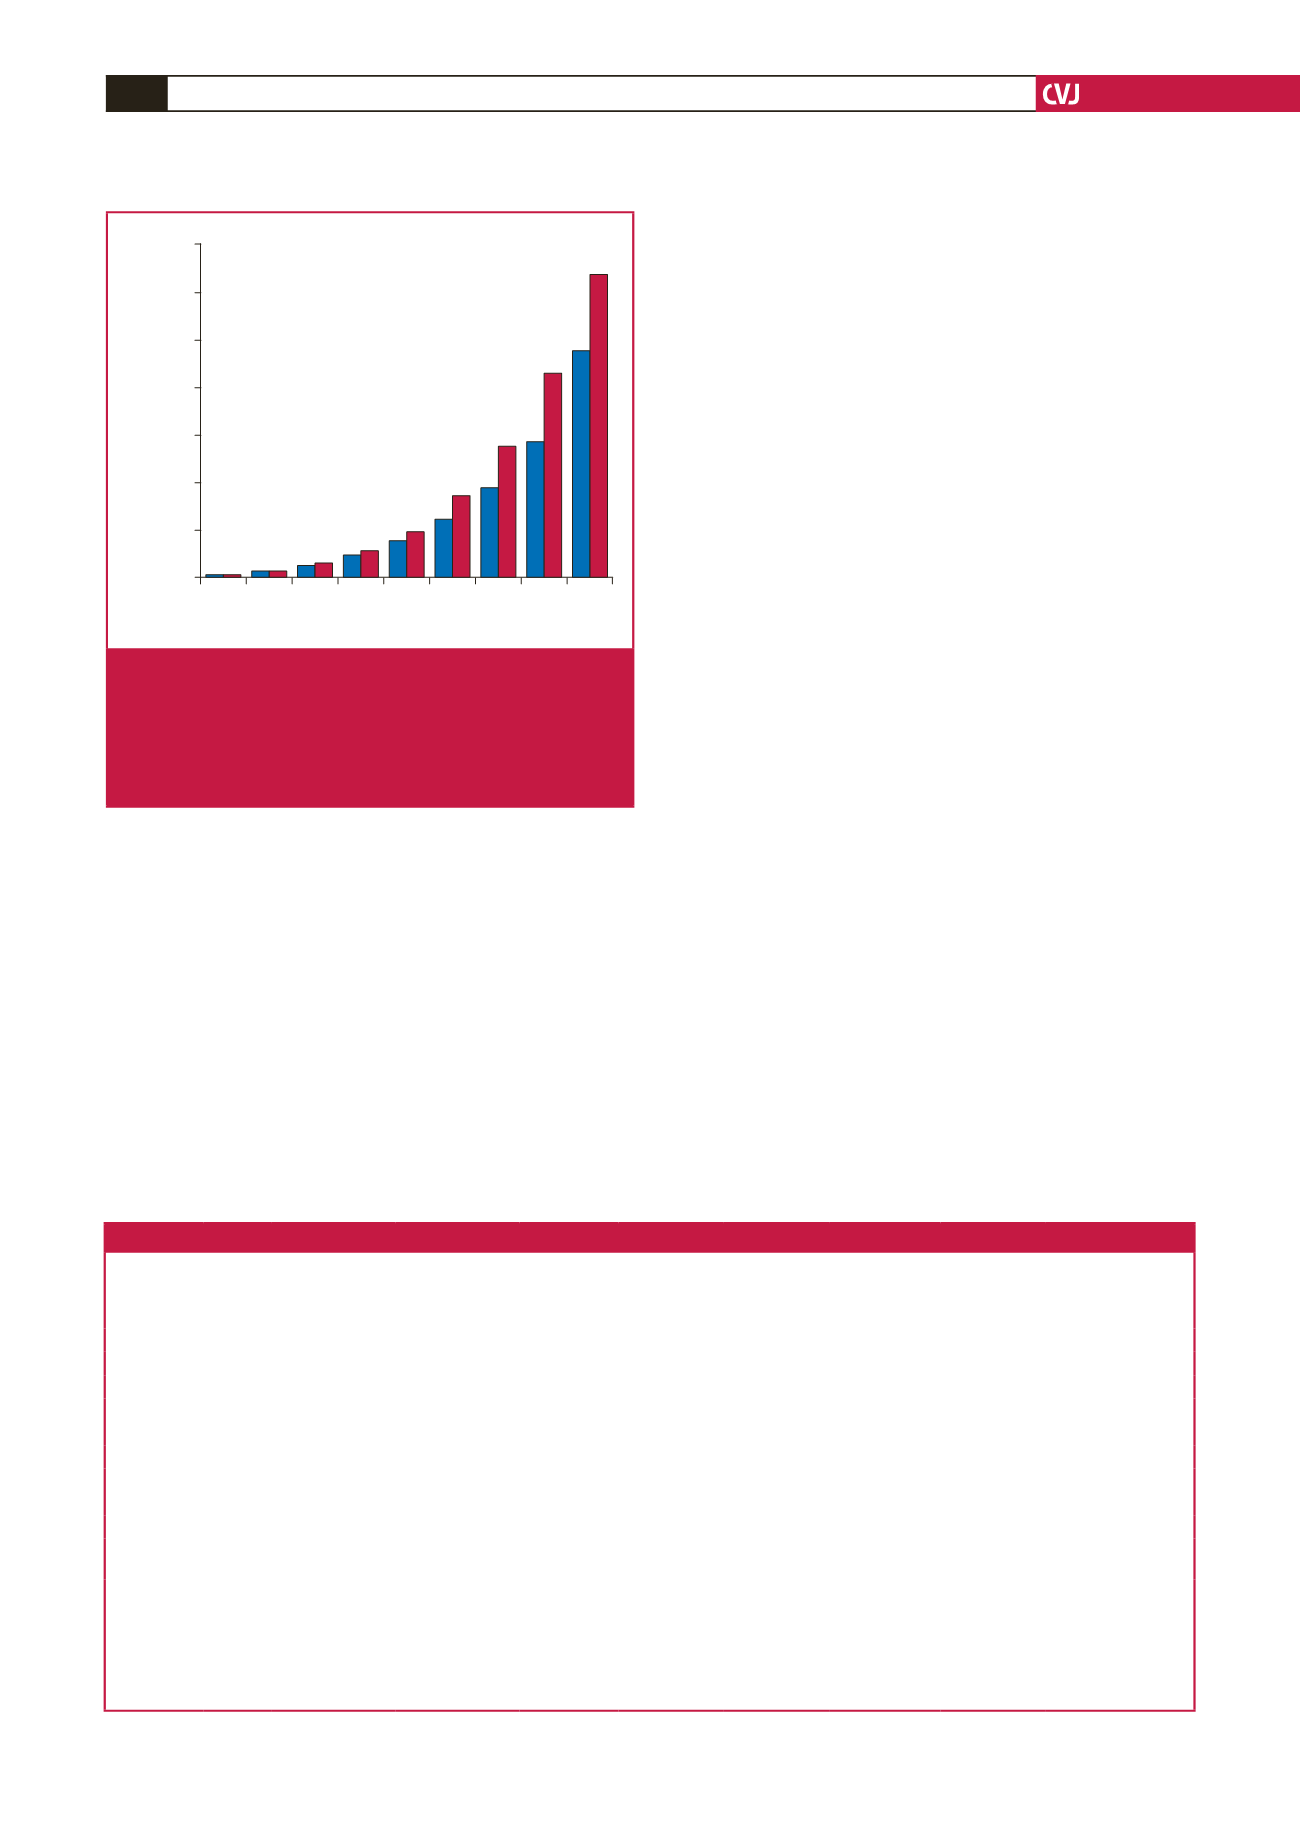
Age groups
35–39 40–44 45–49 50–54 55–59 60–64 65–69 70–74 75–79
Number/100 000
1400
1200
1000
800
600
400
200
0
Fig. 2.
Ischemic heart disease (IHD) mortality rate per age
group in 2017, according to the global burden of
disease study.
1
In parallel with the more rapid increase
in incidence rate (Fig. 1), mortality rates for IHD are
also higher across almost all age groups, as illustrated
by data from sub-Saharan Africa.