


 12 / 76

CARDIOVASCULAR JOURNAL OF AFRICA • Volume 29, No 4, July/August 2018
210
AFRICA
vary significantly by severity of PH (
p
=
0.25). Most participants
(44.7%) had primary education, 32% had secondary education
while 15.3% had never been to school. Variations by severity
of PH were not significant (
p
=
0.69). The 150 followed-up
participants included 11 (7.3%) with mild PH, 44 (29.3%) with
moderate PH and 95 (63.4%) with severe PH. The proportion
of women was 54.7% overall, and 5, 20 and 57%, respectively
among the mild, moderate and severe PH groups (
p
=
0.09).
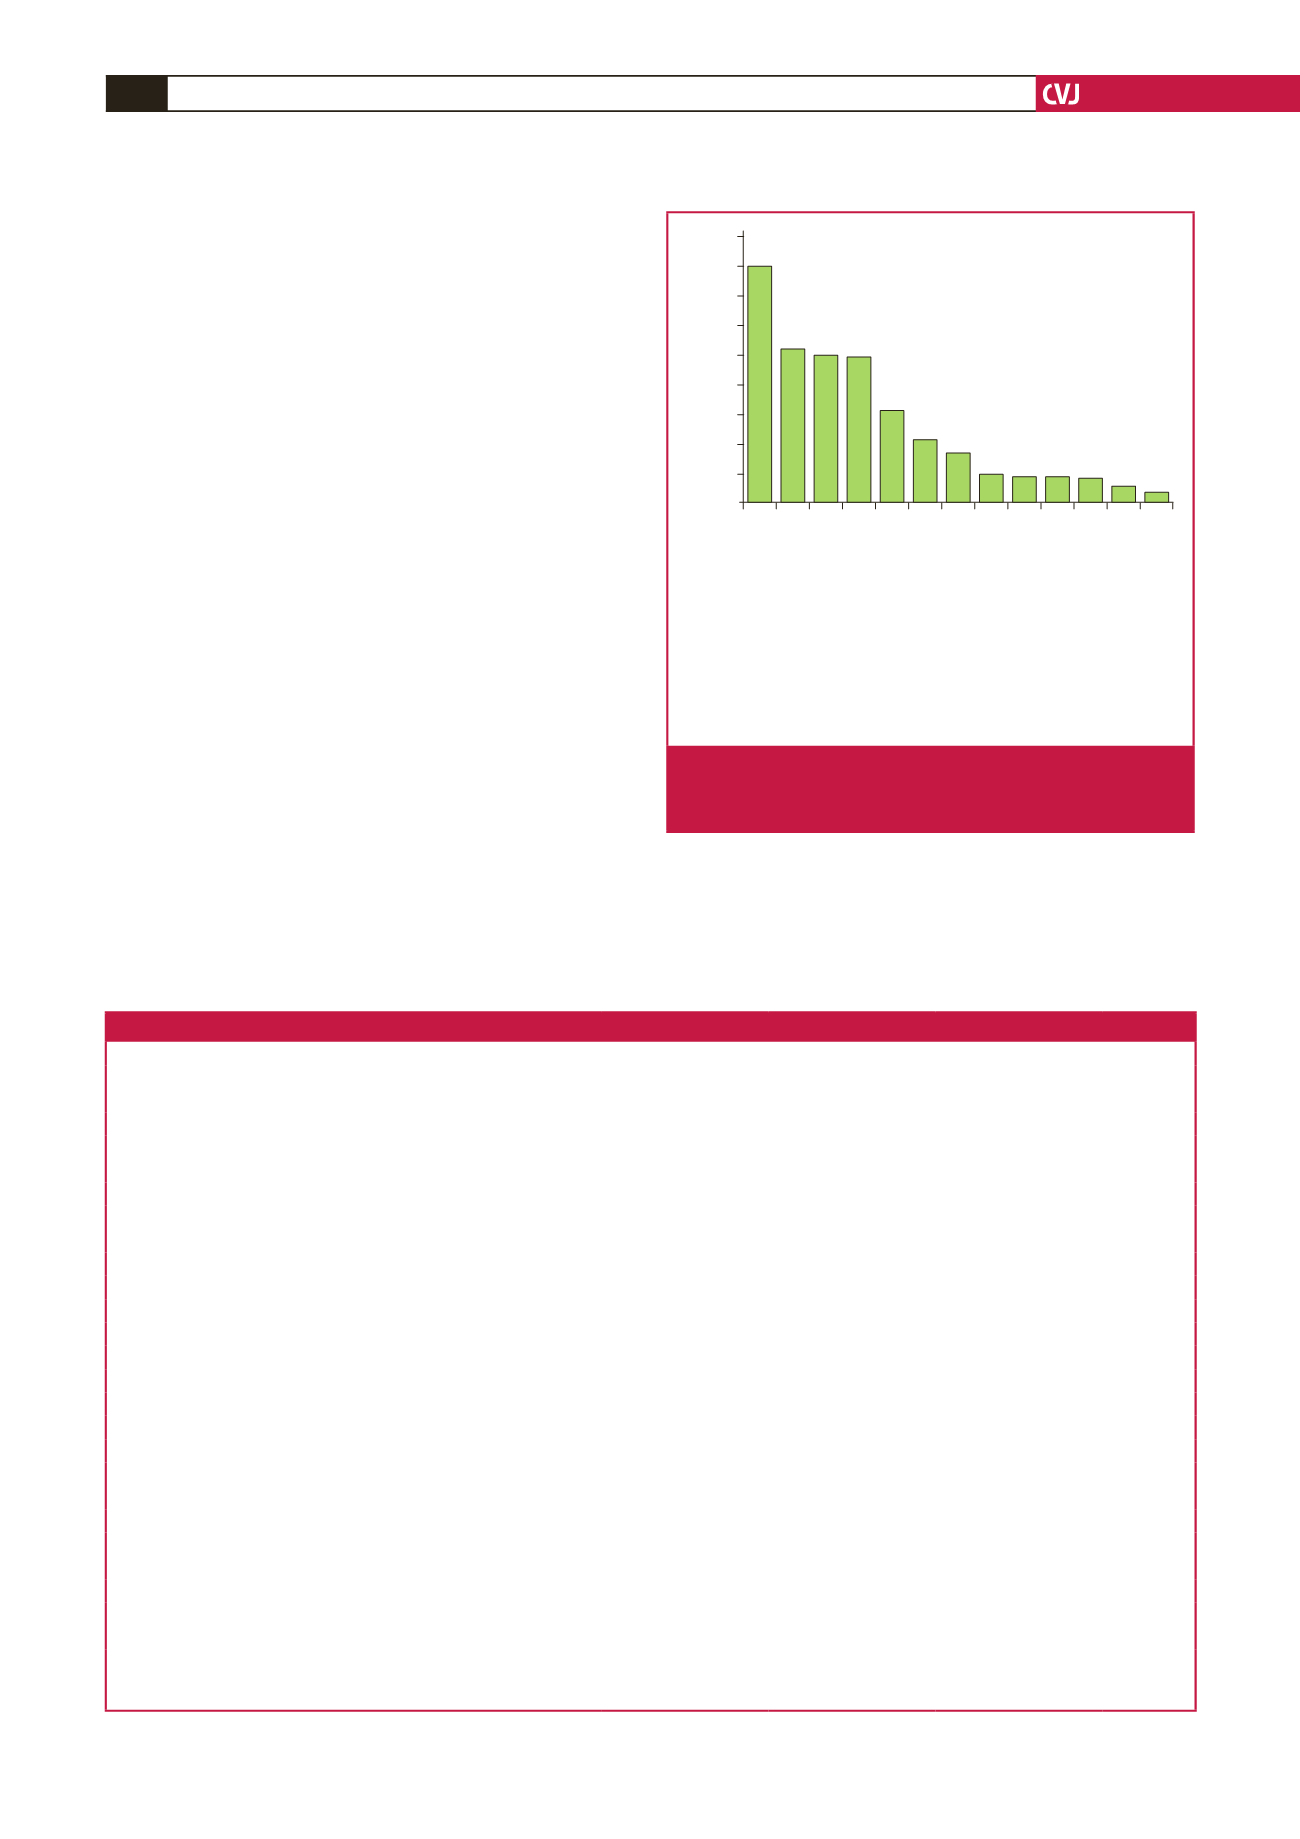
The distribution of risk factors for PH and co-morbidities are
depicted in Fig. 2. Exposure to cooking fumes (80.7%), systemic
hypertension (52.0%), family history of cardiovascular disease
(50.0%), mitral valve regurgitation (49.3%), diabetes (31.3%)
and alcohol abuse (21.3%) were the most common factors and
co-morbidities identified in our study participants.
Dyspnoea (78.7%), fatigue (76.7%), palpitation (57.3%) and
non-productive cough (56.7%) were the main symptoms reported
by patients on initial presentation. Syncope (6.7%) and cyanosis
(6.0%) were rarely reported by our patients. Most patients who
participated in this study had distended jugular veins (68.0%)
and peripheral oedema (66.7%). Table 1 summarises variations
in clinical signs and symptoms with PH severity. Chest pain
varied significantly with PH severity (
p
=
0.03)
Fig. 3 shows variations of the World Health Organisation
functional class (WHO FC) according to PH severity. More
than half (53%) of the patients presented in WHO FC III, 28%
presented in class II, while 17 and 2% presented in class IV and I,
respectively. Therefore a greater proportion of patients presented
with marked functional limitation.
The main cause of PH was left heart disease (group 2),
accounting for 64.7% of all cases, as shown in Fig. 4. In addition,
15.3% was due to unclear or multifactorial aetiology (group 5),
10% due to pulmonary arterial hypertension (group 1), 8% due
to lung disease or hypoxia (group 3), and only 2% due to chronic
thromboembolic mechanisms (group 4). Out of 97 participants
with PHLHD, 50.5% had left ventricular systolic dysfunction
(heart failure with reduced ejection fraction, HFrEF: EF ≤ 50%),
Risk factors/co-morbidities
Percentage of patients with PH
Ind smoke
MVR
Dyslipidaemia
CLD
HTN
Diabetes
Ex-smoker
Cur smoker
FHCVD
Alc abuse
HIV
CLiD
PE
90
80
70
60
50
40
30
20
10
0
n
=
150
3.3
5.3
8.0
8.7
8.7
9.3
16.7
21.3
31.3
49.3
50.0
52.0
80.7
Ind Smoke = exposure to smoke from burning firewood, HTN = hypertension,
FHCVD = family history of cardiovascular disease, MVR = mitral valve
regurgitation, Alc abuse = alcohol abuse, CLD = chronic lung disease, Cur
smoker = current smoker, CLiD = chronic liver disease, PE = pulmonary
embolism.
Fig. 2.
Risk factors and co-morbidities among 150 patients
with pulmonary hypertension followed up at the
Shisong Cardiac Centre.
Table 1. Clinical and echocardiographic findings of adult patients with PH
Parameters
All (
n
=
150)
Mild PH (
n
=
11) Moderate PH (
n
=
44) Severe PH (
n
=
95)
p
-value
Clinical features at presentation
Difficulty breathing (dyspnoea),
n
(%)
118 (78.7)
9 (7.6)
32 (27.1)
77 (65.3)
0.32
Cyanosis,
n
(%)
9 (6.0)
1 (11.1)
2 (22.2)
6 (66.7)
0.58
Non-productive cough,
n
(%)
85 (56.7)
10 (11.8)
22 (25.9)
53 (62.3)
0.14
Fatigue,
n
(%)
115 (76.7)
8 (7.0)
30 (26.0)
77 (67.0)
0.10
Syncope,
n
(%)
10 (6.7)
0
3 (30.0)
7 (70.0)
0.33
Palpitations,
n
(%)
86 (57.3)
8 (9.3)
28 (32.6)
50 (58.1)
0.06
Chest pain,
n
(%)
49 (32.7)
6 (12.2)
17 (34.7)
26 (53.1)
0.03
Distended jugular veins,
n
(%)
102 (68.0)
8 (7.8)
26 (25.5)
68 (66.7)
0.22
Peripheral oedema,
n
(%)
100 (66.7)
9 (9.0)
25 (25.0)
66 (66.0)
0.43
NYHA I and II,
n
(%)
45 (30.0)
3 (6.0)
19 (42.2)
23 (51.1)
0.13
NYHA III and IV,
n
(%)
105 (70.0)
8 (7.6)
25 (23.8)
72 (68.6)
0.13
Vital signs
BMI (kg/m
2
)
26.3 (18–46.8)
23.9 (21.2–26)
26.2 (18.6–42.4)
27.1 (18–46.8)
0.03
Systolic BP (mmHg)
126 (65–250)
133 (102–190)
123 (95–235)
127 (65–250)
0.26
Diastolic BP (mmHg)
79 (45–154)
73 (58–106)
78 (60–154)
80 (45–130)
0.73
Heart rate (beats/min)
88 (52–150)
96 (80–119)
88 (52–120)
86 (56–150)
0.43
Respiratory rate (breaths/min)
23 (13–40)
22 (19–28)
22 (13–35)
23 (15–40)
0.20
O
2
saturation (%)
93 (55–100)
90 (82–98)
94.5 (67–99)
91.5 (55–100)
0.37
Echographic parameters
LVEDD (mm)
53 (16–72)
36 (18–56)
50 (38–70)
55 (16–72)
0.0001
LVESD (mm)
42 (13–60)
35 (13–43)
42 (22–60)
42 (18–97)
0.003
Ejection fraction (%)
48 (20–91)
66 (32–91)
46 (32–72)
46 (20–88)
0.06
Fractional shortening (%)
23 (6–95)
49 (28–61)
29 (18–33)
21 (6–95)
0.09
TAPSE (mm)
10 (7–25)
11 (8–20)
10 (8–17)
10 (7–25)
0.70
Data are number (%) or median (IQR).
BMI
=
body mass index, O
2
=
oxygen, LVEDD
=
left ventricular end-diastolic diameter, LVESD
=
left ventricular end-systolic diameter, TAPSE
=
tricuspid annular
plane systolic excursion.