


 16 / 67

CARDIOVASCULAR JOURNAL OF AFRICA • Vol 24, No 2, March 2013
14
AFRICA
We either pre-treated the animals with
P
glandulosa
, starting
at the onset of the diet, or we allowed the animals to become
severely hypertensive (12 weeks) and then started the treatment.
We included a group of animals treated with the angiotensin
converting enzyme (ACE) inhibitor captopril from the onset of
the diet, as a positive control in this study.
As can be seen in Fig. 6A, captopril prevented the development
of hypertension in the animals. Similarly,
P glandulosa
treatment
prevented the development of high blood pressure in these
animals when given in conjunction with the high-fat diet.
P
glandulosa
treatment did not significantly affect the animals
on the control diet (Fig. 6B). In addition, treatment of already
hypertensive animals (week 12) with
P
glandulosa
normalised
their blood pressure within two weeks.
Effects on urine production
Measuring the urine output of the animals by keeping them
separately in metabolic cages showed that after the 12-week
treatment period, the urine output of animals on the control
diet was 17.37
±
0.8 ml while those on the high-fat diet had a
significantly lower urine output of 9.8
±
0.55 ml (
p
<
0.001,
n
=
9 per group).
*
*
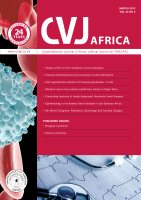
Fig. 5. Hearts from the treated and untreated DIO animals
were removed without any intervention and stored in
liquid nitrogen. Tissue lysates were prepared andWestern
blotting was performed as described in Methods. A: bar
charts of the expression of the PTEN protein as well as
the ratio of phosphorylated vs total protein. *
p
<
0.05,
n
=
6 individual hearts analysed per group. B is a representa-
tive blot depicting these proteins and beta-tubulin, used
as an indicator of equal loading.
2.0
1.5
1.0
0.5
0.0
500
400
300
200
100
0
Control
DIO
Control
Diet
Arbitrary densitrometry units
Ratio (phospho/total)
minus treatment
minus treatment
plus treatment
plus treatment
A
B
Beta-tubulin
Phospho-PTEN
Total PTEN
Contr
Contr + Tr
DIO + Tr
DIO
TABLE 2. SUMMARY OF THEWESTERN BLOTANALYSES
OF THE PROTEINS INVOLVED IN THE INSULIN SIGNAL
TRANSDUCTION PATHWAYWITHARROWS INDICATINGTHE
EFFECT INDUCED BY THE DIETALONE OR THE DIET IN
COMBINATIONWITH
P GLANDULOSA
TREATMENT. HEARTS
WERE FREEZE-CLAMPED IN THE BASAL STATEWITHOUT
ANY INTERVENTIONS
Protein
Effect of diet
Effect of treatment
Glut 1
↔
↔
Glut 4
↔
↔
IR-beta
↔
↔
PKB/Akt
P/T
↓
P/T
↑
p85
↓
↔
PTEN
↔
T
↓
P/T
↑
P
=
phosphorylated protein, T
=
total protein; P/T
=
the ratio of phosphor-
ylated to total protein,
n
=
6 individual hearts per group.
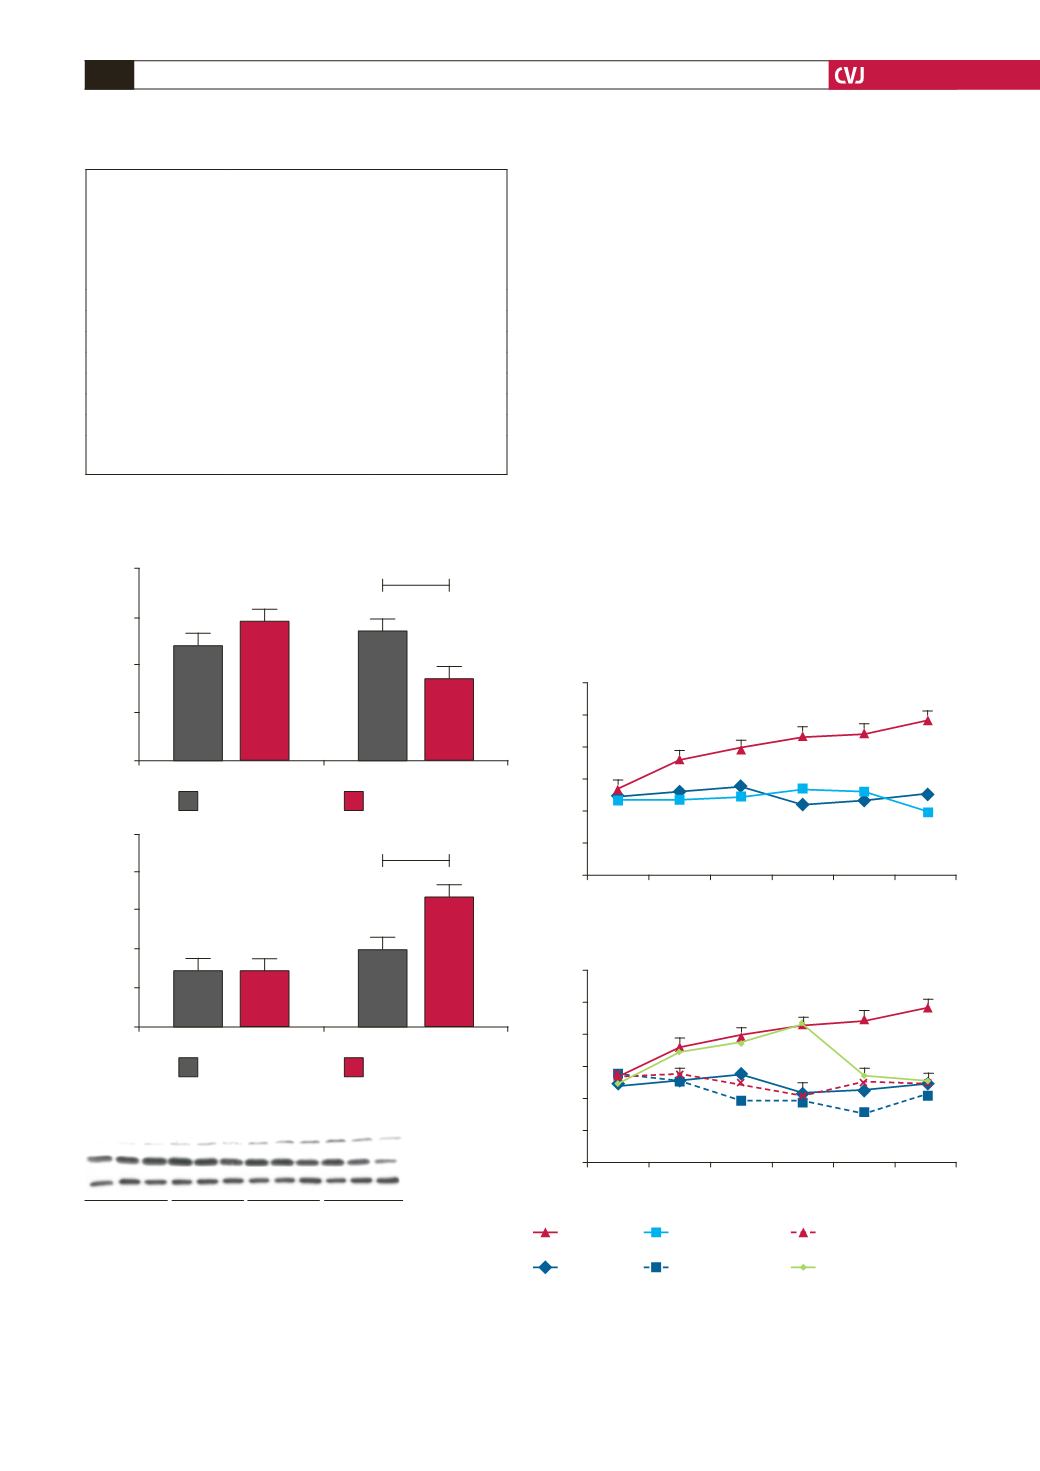
Fig. 6. Rats were fed a high-fat diet for 16 weeks and
blood pressure was monitored on a weekly basis as
described in Methods. *
p
<
0.001 vs control and captopril,
n
=
9 per group. A: HFD vs captopril, B: HFD vs
P glan-
dulosa
treatment.
160
150
140
130
120
110
100
1
4
8
12
14
16
mmHg
Weeks
*
*
*
*
*
160
150
140
130
120
110
100
1
4
8
12
14
16
mmHg
Weeks
*
*
*
*
*
HFD
HFD +
P glandulosa
from day 1
Control
HFD +
P glandulosa
from week 12
Captopril
Control +
P glandulosa
A
B