


 49 / 78

CARDIOVASCULAR JOURNAL OF AFRICA • Volume 30, No 1, January/February 2019
AFRICA
47
Assuming approximately 10% lost to follow up, 160 patients were
randomised.
All statistical analyses were performed using the SPSS
statistical software (graduate pack for Windows, version 20).
For categorical variables, the frequencies and percentages
were calculated. Continuous variables are presented as means
± SD and were compared using the Student’s
t
-test or the
Mann–Whitney
U
-test as appropriate. Categorical variables
are presented as proportions and were compared with the
χ
² or
Fisher’s exact test. A
p
-value
<
0.05 was considered significant.
Results
The study flow chart is described in Fig. 1. Baseline characteristics
of patients are summarised in Table 1. Patients randomised to IC
administration were younger (58.8 ± 14.8 vs 60.6 ± 12.2 years)
and less frequently hypertensive (36 vs 53%). An increased waist
circumference was less frequently observed (6.4 vs 22.2%,
p
<
0.05).
There was no significant difference with regard to the patients’
past history between the groups, including prior coronary artery
bypass graft (CABG), PCI, stroke and peripheral artery disease.
Previous AMI was less frequent among patients with IC versus
IV abciximab (5.1 vs 19.5%,
p
=
0.05). There was no significant
difference between the two groups with regard to delay from
symptom onset to balloon, heart rate, systolic and diastolic
blood pressure, heart failure signs and left ventricular ejection
fraction (LVEF) at admission.
Pre-procedural features of the target vessel lesions and
coronary angiography findings are summarised in Table 2. The
infarct-related coronary artery was the left anterior descending
coronary artery (LAD) in 62% of patients with IC and 61% with
IV administration (
p
=
0.470). Single-vessel disease was observed
in 70.5 vs 57% in patients with IC vs IV administration (
p
=
0.127). There was no difference with regard to pre-PCI TIMI
flow between the two groups. A TIMI flow of 0 (occlusion) was
observed in 67% with IC compared to 72% of those with IV
administration (
p
=
0.799).
Procedural characteristics of the two groups are shown
in Table 3. There was no difference between the two groups
with regard to radial catheterisation, aspiration thrombectomy
and stenting rates. Manual aspiration thrombectomy was
systematically performed before angioplasty or stenting.
No serious complications, such as flow-limiting dissection
or air embolisation occurred after angiography. Direct
Table 1. Baseline characteristics of patients
Variables
All patients,
n
=
160
IV abcix-
imab,
n
=
82
IC abcix-
imab,
n
=
78
p
-value
Patients
Age, years
59.7 ± 13.5 60.6 ± 12.2 58.8 ± 14.8 0.383
Men,
n
(%)
137 (85.6)
72 (87.8)
65 (83.3)
0.420
Cardiovascular risk factors
Diabetes,
n
(%)
54 (33.8)
30 (36.6)
24 (30.8)
0.437
Hypertension,
n
(%)
72 (45)
44 (53.7)
28 (35.9)
0.024
Smokers,
n
(%)
67 (41 .9)
29 (35.4)
38 (48.7)
0.087
Dyslipidaemia,
n
(%)
30 (18.8)
16 (19.5)
14 (17.9)
0.8
Obesity,
n
(%)
23 (14.4)
18 (22.2)
5 (6.4)
0.005
Heredity,
n
(%)
9(5.6)
4 (4.9)
5 (6.4)
0.674
Past history
Stroke,
n
(%)
6 (3.8)
5 (6.1)
1 (1.3)
0.109
Peripheral artery
disease,
n
(%)
4 (2.5)
3 (3.7)
1 (1.3)
0.336
Previous MI,
n
(%)
20 (12.5)
16 (19.5)
4 (5.1)
0.006
Previous PCI,
n
(%)
10 (6.3)
8 (8.9)
2 (2.6)
0.06
Clinical findings
Heart rate, bpm 86.2 ± 21.7 84.8 ± 21.8 87.7 ± 21.6 0.852
Mean systolic blood
pressure, mmHg
137.5 ± 24.9 136.8± 27.0 138.1 ± 22.6 0.321
Killip class,
n
(%):
1
149 (93.1)
75 (91.5)
74 (94.9)
0.585
2
2 (1.3)
5 (6.1)
0
3
9 (5.6)
2 (2 .4)
4 (5.1)
Delay from symptom
onset to cathlab, min
334.8 ± 192.1 345.2 ± 204.3 323.8 ± 179.1 0.481
LVEF, %
52.6 ± 10.1 52.7 ± 10.1 52.5 ± 10.3 0.902
LVEF: left ventricular ejection fraction; MI: myocardial infarction; PCI: percu-
taneous coronary intervention.
Table 2.Target-vessel characteristics
Variables
All patients,
n
=
160
IV abcix-
imab,
n
=
82
IC abcix-
imab,
n
=
78
p
-value
Anterior MI,
n
(%)
104 (65)
53 (64.6)
51 (65.4)
0.921
Posterior/inferior MI,
n
(%)
56 (35)
29 (35.4)
27 (34.6)
Single vessel,
n
(%)
102 (63.8)
47 (57.3)
55 (70.5)
0.127
2 vessels,
n
(%)
40 (25)
26 (31.7)
14 (17.9)
3 vessels,
n
(%)
18 (11.3)
9 (11)
9 (11.5)
TIMI flow:
0,
n
(%)
111 (69.4)
59 (72)
52 (66.7)
0.799
1,
n
(%)
11 (6.9)
6 (7.3)
5 (6.4)
2,
n
(%)
21 (13.1)
10 (12.2)
11 (14.1)
3,
n
(%)
17 (10.6)
7 (8.5)
10 (12.8)
TIMI: thrombolysis in myocardial infarction.
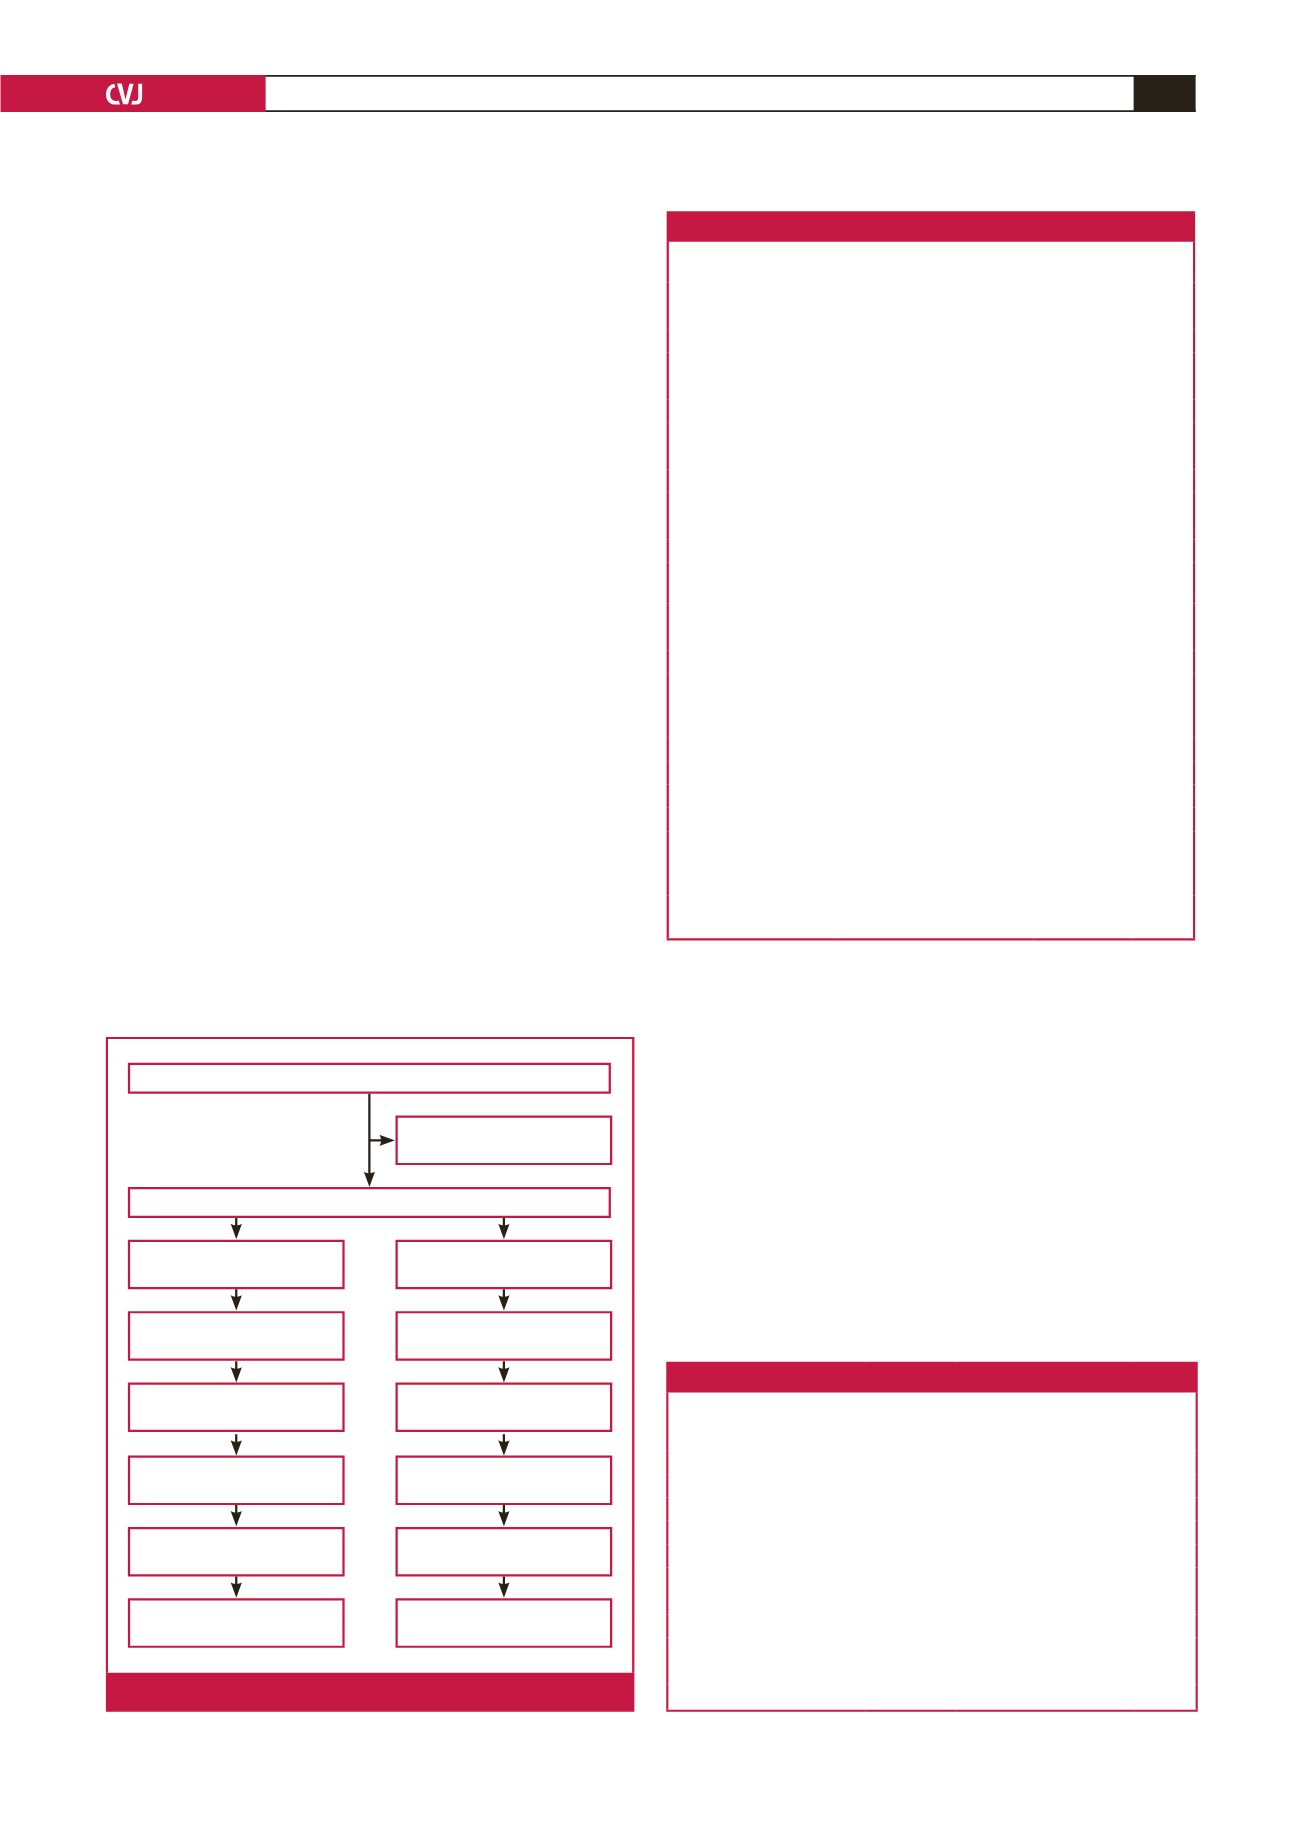
Patients admitted with STEMI <12 h,
n
= 172
Excluded for exclusion
criteria,
n
= 12
Patients included 2013-09-01 to 2015-10-30,
n
= 160
Patients randomised to IV
abciximab bolus,
n
= 82
Patients randomised to IC
abciximab bolus,
n
= 78
Aspiration thrombectomy:
62 patients
Aspiration thrombectomy:
68 patients
ECG criteria: available for
78 patients
ECG criteria: available for
82 patients
Angiographic criteria:
available for 82 patients
Angiographic criteria:
available for 78 patients
MACE at 1 month: available
for 75 patients
MACE at 1 month: available
for 79 patients
MACE at 6 months:
available for 70 patients
MACE at 6 months:
available for 71 patients
Fig. 1.
Study flow chart. MACE: major cardiac events.