


 65 / 78

CARDIOVASCULAR JOURNAL OF AFRICA • Volume 30, No 1, January/February 2019
AFRICA
63
variables that correlatewith right heart haemodynamics, including
an estimate of right ventricular systolic pressure (RVSP), and can
simultaneously uncover functional and morphological cardiac
sequelae of PH, and assist in the identification of possible
cardiac causes of PH.
The Doppler echo estimation of RVSP (Fig. 3A) is based on
the peak velocity of the jet of tricuspid regurgitation (TR). TR
velocity can be obtained by either a duplex imaging from the
right ventricular inflow view, parasternal short-axis view at the
basal level, para-apical four-chamber view, apical four-chamber
view, or even the subcostal view. The TR maximal instantaneous
gradient (TR MIG) is frequently automatically calculated and
displayed on the screen (Fig. 3A) when the maximal TR velocity
is measured. Otherwise it is easily calculated using the simplified
Bernoulli equation:
12
TR MIG
=
4 (TR velocity)²
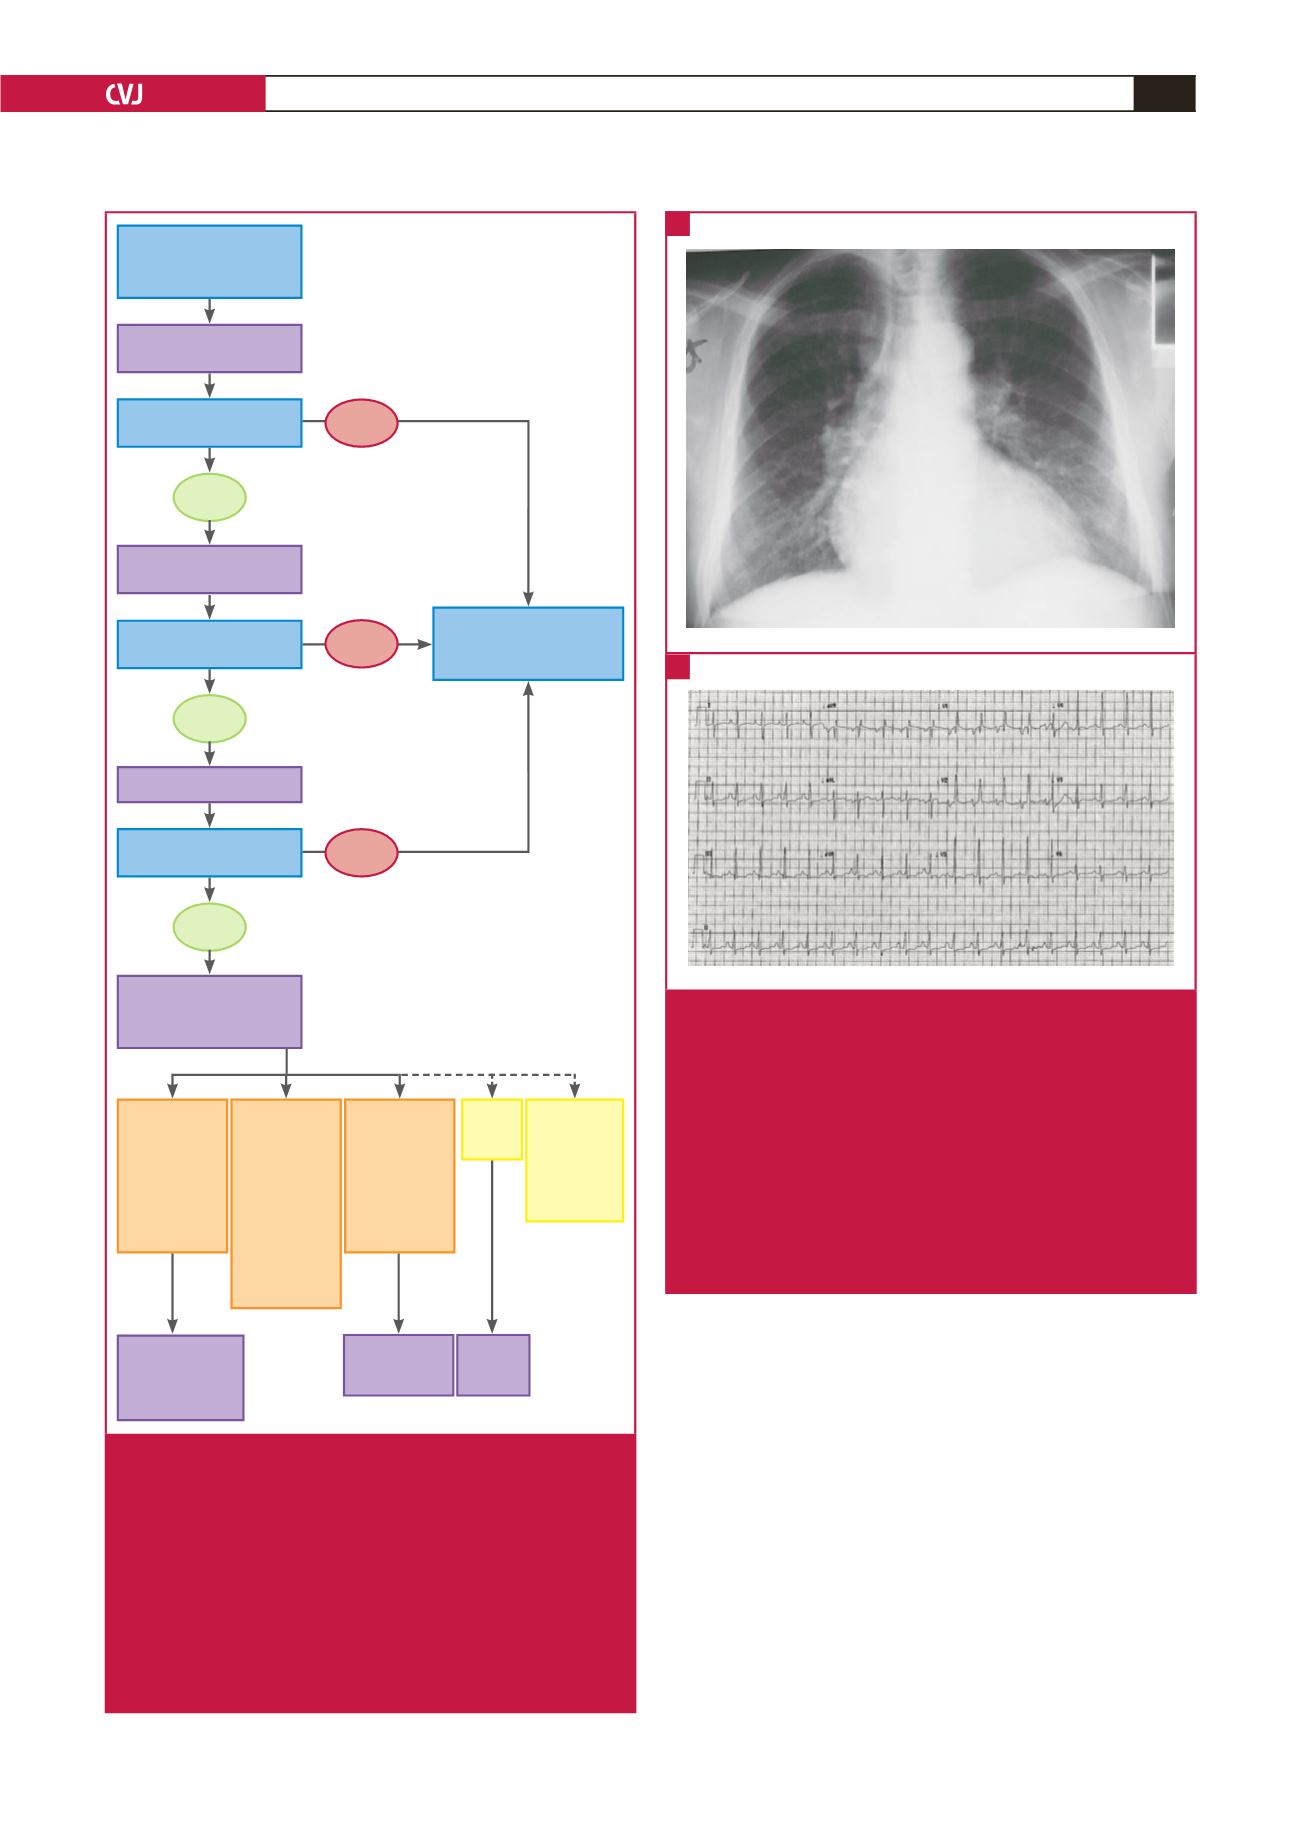
Fig. 2.
Chest X-ray and electrocardiogram in pulmonary
hypertension in sub-Saharan Africa. (A) Postero-
anterior chest X-ray in a 51-year-old HIV-positive
patient on antiretroviral therapy and with a past history
of diabetes and one episode of TB, who presented
with dyspnoea. CXR showing no signs of chronic lung
disease, but combined heart enlargement and hilar
pulmonary artery prominence. (B) ECG of a different
patient showing sinus tachycardia, right atrial enlarge-
ment, right ventricular hypertrophy and strain, and
right-axis deviation of the QRS complex. Courtesy of
the PAPUCO investigators group.
A
B
Step 1: clinical examination
Symptoms, signs and
medical history suggestive
of PH
Clinical examination
supportive of PH
Step 2: chest X-ray
and ECG
Search for other causes,
e.g. TB, PCP, COPD, LHD,
malignancy
Chest X-ray and ECG
supportive of PH
Step 4:
CTPA,
V/Q scan
Step 3: Doppler echo
Group 5
Multifactorial
e.g. endo-
myocardial
fibrosis, sickle
cell disease
Group 4
CTEPH
Group 2
PH due to left
heart disease:
e.g. mitral
stenosis
due to RHD,
hypertensive
heart failure,
valvular disease,
coronary artery
disease
Group 3
PH due to lung
disease:
e.g. COPD,
post-TB
bronchiectasis,
interstitial lung
disease
Step 4: liver-
function test,
HRCT
Group 1
Pulmonary
arterial
hypertension
(PAH): e.g.
HIV-PAH,
schistosomiasis,
drugs/toxins
Step 4: HIV
testing, urine
screen, abdominal
US, drug screen
Step 4: consider common
causes of PH in Africa
Doppler echo
supportive of PH
YES
YES
YES
NO
NO
NO
Probably less
common
Fig. 1.
Diagnostic algorithm to diagnose pulmonary hyperten-
sion due to left heart disease in low-resource settings,
as evidenced from the PAPUCO study. PH, pulmo-
nary hypertension; TB, tuberculosis; PCP, pneumo-
cystis pneumonia; COPD, chronic obstructive pulmo-
nary disease; LHD, left heart disease; Doppler echo,
Doppler echocardiography; US, ultrasound; LFT, liver-
function tests; HRCT, high-resolution computerised
tomography; CTEPH, chronic thromboembolic pulmo-
nary hypertension; CTPA, CT pulmonary angiography;
V/Q, ventilation/perfusion lung scan.