


 66 / 78

CARDIOVASCULAR JOURNAL OF AFRICA • Volume 30, No 1, January/February 2019
64
AFRICA
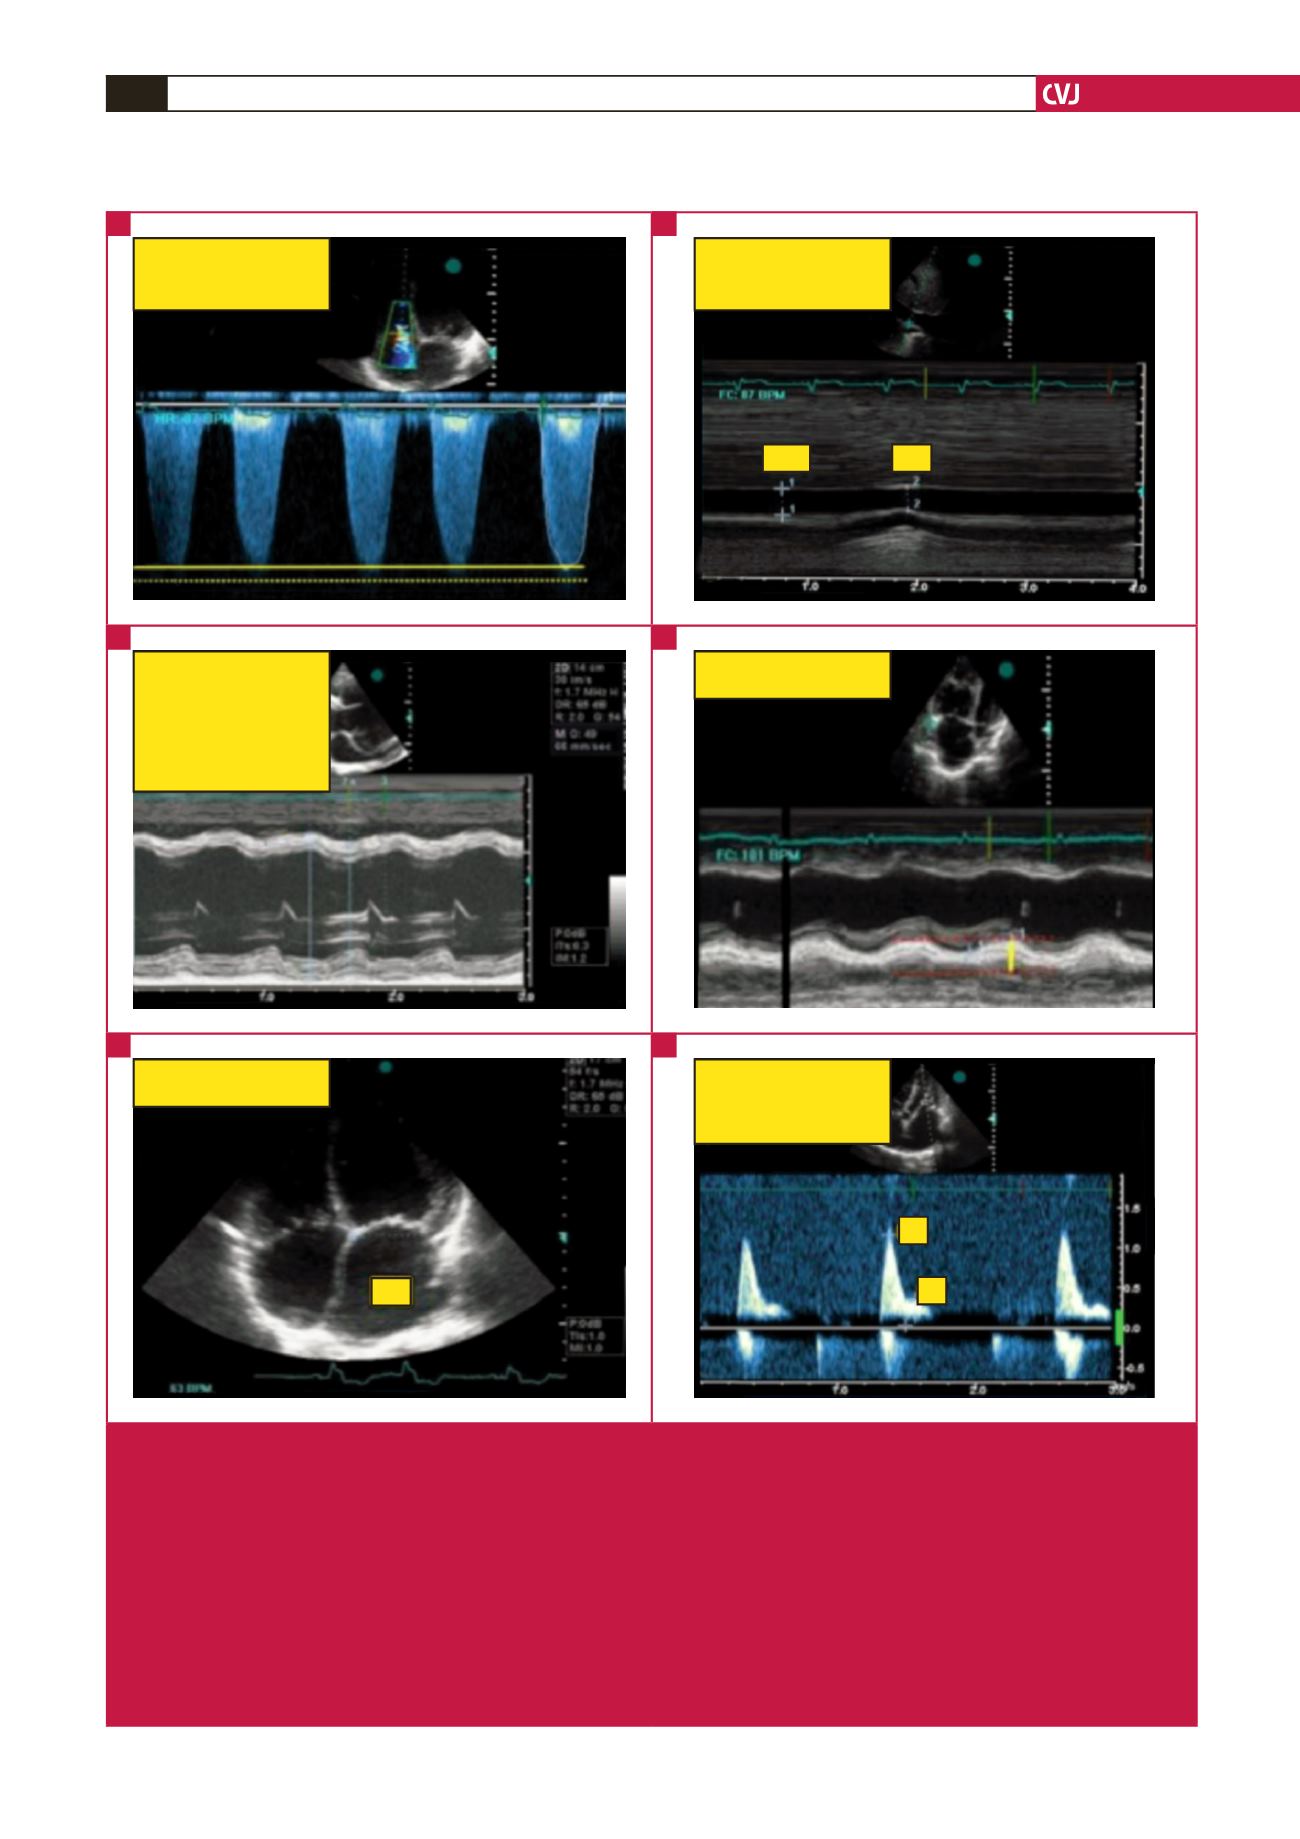
TR Vmax = 3.75 m/s
TR MIG = 56 mmHg
Insp diameter = 2.20 cm
Exp diameter = 1.88 cm
IVC collapsing index = 14.5%
Exp
Insp
IVSd = 0.85 cm
LVEDd = 7.63 cm
PWd = 0.85 cm
IVSs = 1.2 cm
LVESd = 5.97 cm
PWs = 1.1 cm
EF = 43%
TAPSE = 0.79 cm
LA area = 26.1 cm
LA
E = 1.16 m/s
DT = 122msec
A = 0.36 m/s
E/A = 3.24
E
A
Fig. 3.
Echocardiographic evaluation in patients with pulmonary hypertension in sub-Saharan Africa. Measurement of pulmonary
pressure is based on identification of the tricuspid regurgitant (TR) jet and using continuous-wave Doppler to obtain the
maximum instantaneous right ventricular–right atrial gradient, as indicated by the solid yellow line (A). The yellow dotted line
indicates measurement of over-gained (shaggy) signals with significant overestimation in the gradient. TR Vmax indicates
TR maximal velocity, TR MIG, TR maximal instantaneous gradient. (B) Right atrial pressure is estimated from the inferior
vena cava (IVC) calibre and respiratory collapsibility. ins, inspiration, exp, expiration. (C) shows measurements of the ejec-
tion fraction using the Teicholz formula; IV(D/S) indicates interventricular septum (diastole/systole), LVED(S)d: left ventricular
end-diastolic (systolic) diameter, PWd(s): posterior wall in diastole (systole). (D) indicates the measurement of the tricuspid
annular plane systolic excursion (TAPSE) in a patient with right heart failure. (E) A visual assessment of right cardiac cavi-
ties in apical four-chamber view showing dilated heart cavities. (F) indicates a restrictive mitral Doppler pattern in the same
patient. Modified from thesis ‘Predicting pulmonary hypertension and outcomes in patients with left heart disease’. http://hdl.
handle.net/11427/16533.A
C
D
B
D
F