


 72 / 78

CARDIOVASCULAR JOURNAL OF AFRICA • Volume 30, No 1, January/February 2019
e2
AFRICA
underwent successful patch closure.
The electrocardiogram revealed sinus bradycardia with
marked T-wave inversion. A chest X-ray showed cardiomegaly.
Echocardiography revealed thinning of the wall of the
interventricular septum from the mid left ventricle to the
apex, with an approximately 1.2-cm-sized free-wall defect at
the LV apex, and shunt flow to the aneurysmal sac on colour
Doppler (Fig. 1). Contrast echocardiography demonstrated the
left ventricle with the contrast microbubble flowing into the
aneurysmal area (Fig. 2).
Coronary artery computerised tomography (CT) showed
a huge LV pseudo-aneurysm of 7.5-cm maximum transverse
diameter (Fig. 3). Coronary angiography of the left ventricle also
identified LV apex rupture with a false aneurysm (Fig. 4).
The patient underwent successful surgery with patch closure
using Dacron and bovine pericardium. The operative finding
showed an approximately 1-cm-sized defect at the LV apex with
a pseudo-aneurysm, which may have occurred due to dehiscence
of the previous surgical approach site (Fig. 5).
The patient was discharged without any complications. She
remained asymptomatic after six months of follow up.
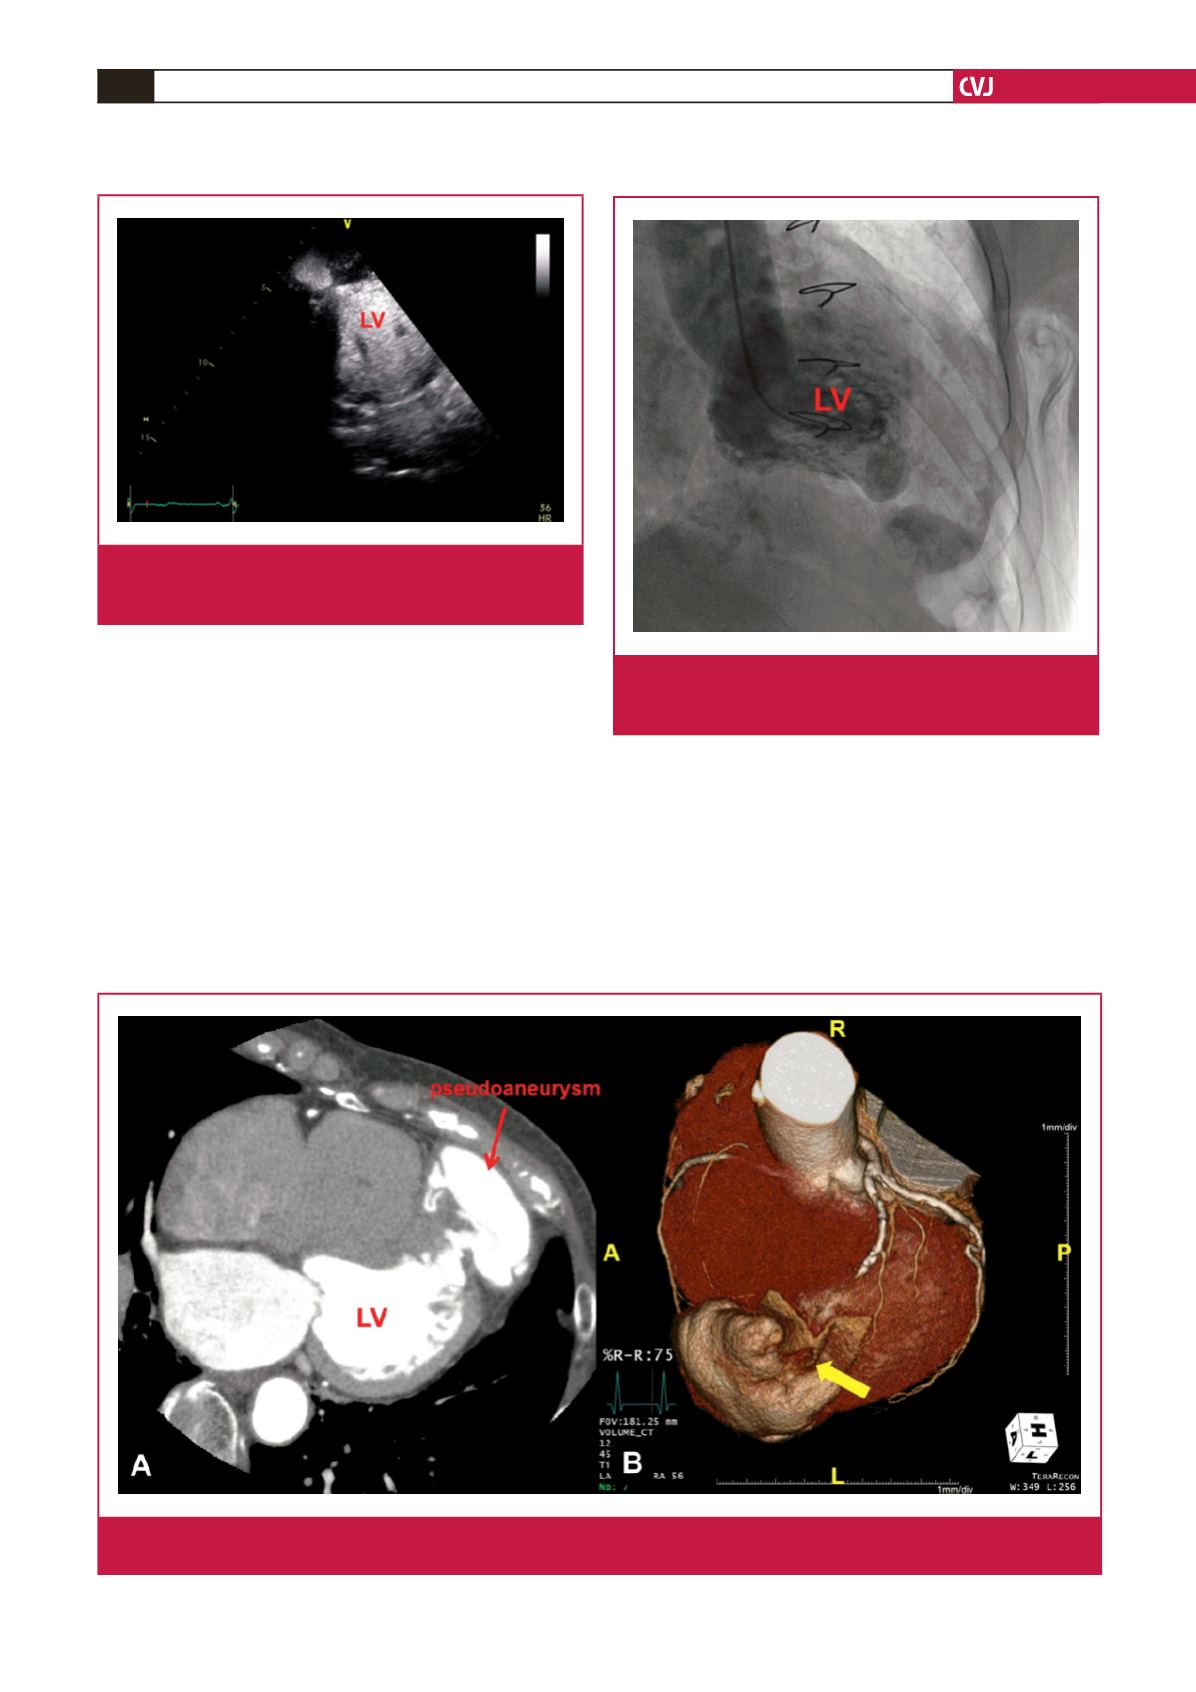
Fig. 2.
Echocardiography with contrast microbubble demon-
strates the left ventricle communicating with the pseu-
do-aneurysm through a small defect. LV, left ventricle.
Fig. 3.
Coronary computerised tomography shows the left ventricular pseudo-aneurysm with a broad base and narrow orifice (A),
and patch dehiscence (arrow) in three-dimensional reconstruction (B). LV, left ventricle.
Fig. 4.
Left ventriculography with contrast agent shows the
left ventricle connecting to the false aneurysm via a
narrow neck. LV, left ventricle.